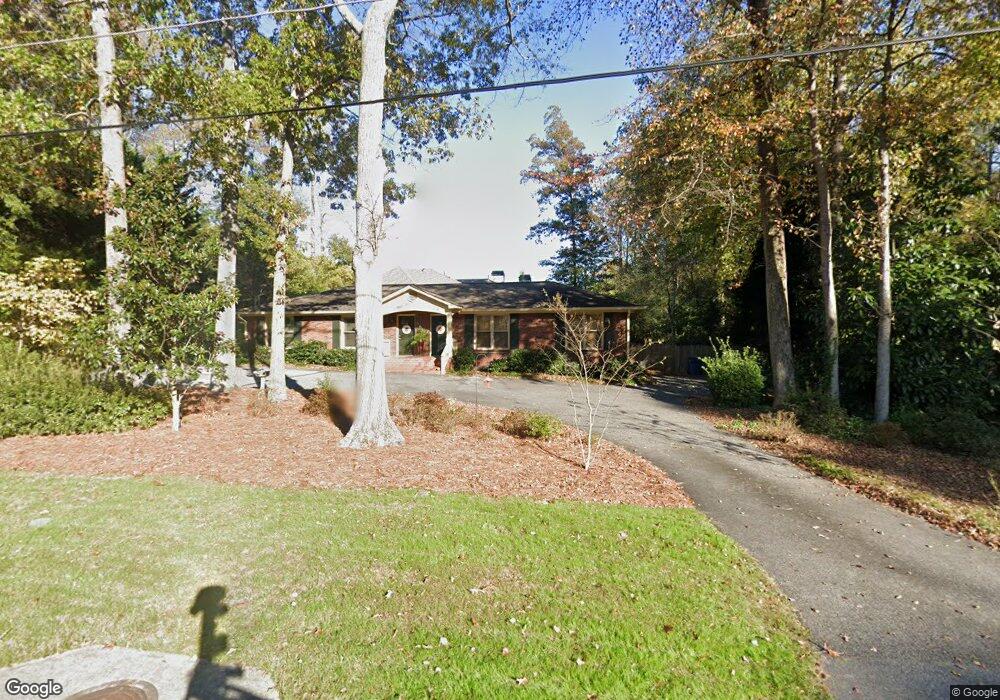
303 Hook St Alpharetta, GA 30009
Estimated Value: $612,000 - $819,643
4
Beds
2
Baths
1,650
Sq Ft
$441/Sq Ft
Est. Value
About This Home
This home is located at 303 Hook St, Alpharetta, GA 30009 and is currently estimated at $727,161, approximately $440 per square foot. 303 Hook St is a home located in Fulton County with nearby schools including Alpharetta Elementary School, Hopewell Middle School, and Cambridge High School.
Ownership History
Date
Name
Owned For
Owner Type
Purchase Details
Closed on
Oct 30, 2021
Sold by
Farhang Pejman
Bought by
Farhang Pejman and Farhang Firooz
Current Estimated Value
Purchase Details
Closed on
Sep 10, 2021
Sold by
Joiner Collin
Bought by
Farhang Pejman
Home Financials for this Owner
Home Financials are based on the most recent Mortgage that was taken out on this home.
Original Mortgage
$403,750
Interest Rate
3%
Mortgage Type
New Conventional
Purchase Details
Closed on
Jul 26, 2021
Sold by
Christian Patricia Loden
Bought by
Joiner Collin
Home Financials for this Owner
Home Financials are based on the most recent Mortgage that was taken out on this home.
Original Mortgage
$403,750
Interest Rate
3%
Mortgage Type
New Conventional
Purchase Details
Closed on
Oct 10, 2017
Sold by
Richard Jacob G
Bought by
Christian Patricia Loden
Home Financials for this Owner
Home Financials are based on the most recent Mortgage that was taken out on this home.
Original Mortgage
$244,000
Interest Rate
3.78%
Mortgage Type
New Conventional
Purchase Details
Closed on
Oct 7, 2014
Sold by
Jacob G R
Bought by
Jacob G Richard Jacob M and Trustees Of The Richard & Mary
Create a Home Valuation Report for This Property
The Home Valuation Report is an in-depth analysis detailing your home's value as well as a comparison with similar homes in the area
Home Values in the Area
Average Home Value in this Area
Purchase History
| Date | Buyer | Sale Price | Title Company |
|---|---|---|---|
| Farhang Pejman | -- | -- | |
| Farhang Pejman | -- | -- | |
| Farhang Pejman | $539,000 | -- | |
| Joiner Collin | $475,000 | -- | |
| Christian Patricia Loden | $305,566 | -- | |
| Jacob G Richard Jacob M | -- | -- |
Source: Public Records
Mortgage History
| Date | Status | Borrower | Loan Amount |
|---|---|---|---|
| Previous Owner | Joiner Collin | $403,750 | |
| Previous Owner | Christian Patricia Loden | $244,000 |
Source: Public Records
Tax History
| Year | Tax Paid | Tax Assessment Tax Assessment Total Assessment is a certain percentage of the fair market value that is determined by local assessors to be the total taxable value of land and additions on the property. | Land | Improvement |
|---|---|---|---|---|
| 2025 | $1,099 | $273,040 | $105,720 | $167,320 |
| 2023 | $5,138 | $182,040 | $65,680 | $116,360 |
| 2022 | $4,098 | $155,760 | $41,480 | $114,280 |
| 2021 | $2,981 | $109,880 | $35,440 | $74,440 |
| 2020 | $3,525 | $105,080 | $41,520 | $63,560 |
| 2019 | $580 | $100,800 | $24,480 | $76,320 |
| 2018 | $2,779 | $98,440 | $23,920 | $74,520 |
| 2017 | $2,036 | $69,800 | $27,920 | $41,880 |
| 2016 | $2,037 | $69,800 | $27,920 | $41,880 |
| 2015 | $2,447 | $69,800 | $27,920 | $41,880 |
| 2014 | $1,405 | $45,840 | $18,360 | $27,480 |
Source: Public Records
Map
Nearby Homes
- 193 Jere Dr
- 210 Shady Grove Ln
- 205 Shady Grove Ln
- 250 Mayfield Rd
- 265 Mayfield Rd
- 175 Pebble Trail
- 185 Pebble Trail
- 195 Pebble Trail
- 264 N Main St
- 260 Mayfield Rd
- 254 N Main St
- 205 Mayfield Cir
- 179 Meadow Dr
- 238 Brooke Dr
- 295 Pebble Trail
- 202 Kenneth Dr
- 141 Canton St
- 170 Mayfield Cir
- 326 Andover Dr
- 314 Andover Dr
Your Personal Tour Guide
Ask me questions while you tour the home.