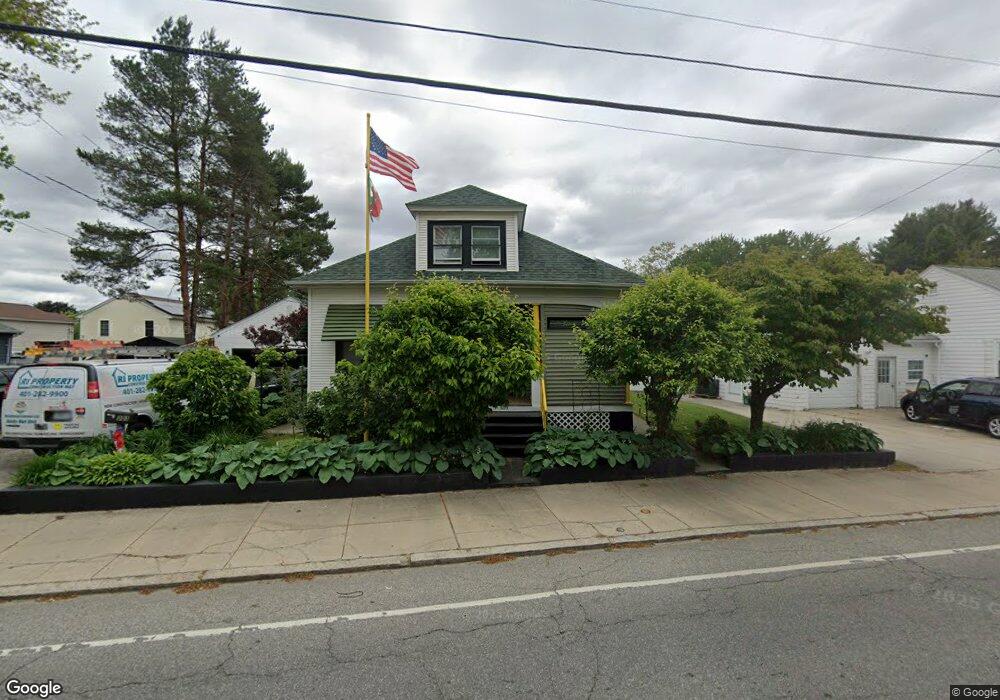
303 Killingly St Providence, RI 02909
Hartford NeighborhoodEstimated Value: $341,000 - $442,000
2
Beds
1
Bath
1,800
Sq Ft
$221/Sq Ft
Est. Value
About This Home
This home is located at 303 Killingly St, Providence, RI 02909 and is currently estimated at $397,259, approximately $220 per square foot. 303 Killingly St is a home located in Providence County with nearby schools including Achievement First Promesa, Achievement First Providence Mayoral Academy Elementary School, and Achievement First Providence Mayoral Academy Elementary.
Ownership History
Date
Name
Owned For
Owner Type
Purchase Details
Closed on
Sep 15, 2020
Sold by
Nhar Chen
Bought by
Jfd T
Current Estimated Value
Purchase Details
Closed on
Dec 7, 2001
Sold by
Est Joseph F Marcaccio and Marcaccio John G
Bought by
Char Chen
Home Financials for this Owner
Home Financials are based on the most recent Mortgage that was taken out on this home.
Original Mortgage
$111,150
Interest Rate
6.67%
Create a Home Valuation Report for This Property
The Home Valuation Report is an in-depth analysis detailing your home's value as well as a comparison with similar homes in the area
Home Values in the Area
Average Home Value in this Area
Purchase History
| Date | Buyer | Sale Price | Title Company |
|---|---|---|---|
| Jfd T | -- | None Available | |
| Char Chen | $117,000 | -- |
Source: Public Records
Mortgage History
| Date | Status | Borrower | Loan Amount |
|---|---|---|---|
| Previous Owner | Char Chen | $210,000 | |
| Previous Owner | Char Chen | $131,000 | |
| Previous Owner | Char Chen | $111,150 |
Source: Public Records
Tax History
| Year | Tax Paid | Tax Assessment Tax Assessment Total Assessment is a certain percentage of the fair market value that is determined by local assessors to be the total taxable value of land and additions on the property. | Land | Improvement |
|---|---|---|---|---|
| 2025 | $5,072 | $347,400 | $140,500 | $206,900 |
| 2024 | $4,932 | $268,800 | $88,800 | $180,000 |
| 2023 | $4,932 | $268,800 | $88,800 | $180,000 |
| 2022 | $4,785 | $268,800 | $88,800 | $180,000 |
| 2021 | $4,367 | $177,800 | $53,800 | $124,000 |
| 2020 | $4,367 | $177,800 | $53,800 | $124,000 |
| 2019 | $4,367 | $177,800 | $53,800 | $124,000 |
| 2018 | $4,423 | $138,400 | $45,800 | $92,600 |
| 2017 | $4,423 | $138,400 | $45,800 | $92,600 |
| 2016 | $4,423 | $138,400 | $45,800 | $92,600 |
| 2015 | $4,419 | $133,500 | $45,800 | $87,700 |
| 2014 | $4,506 | $133,500 | $45,800 | $87,700 |
| 2013 | $4,506 | $133,500 | $45,800 | $87,700 |
Source: Public Records
Map
Nearby Homes
- 10 Mott St
- 0 Orchard St Unit 1396400
- 0 Orchard St Unit 1400488
- 60 Ophelia St
- 33 Harding Ave
- 102 Ophelia St
- 19 S Long St
- 15 Melissa St
- 129 Glenbridge Ave
- 162 Merino St
- 231 Lowell Ave
- 665 Plainfield St
- 56 N Olney St
- 29 Matson Ave Unit 35
- 166 Lowell Ave
- 240 Eastwood Ave
- 6 Stockwell St
- 140 Cleveland St
- 30 Edgemere Ave
- 32 Harrington Dr
- 2 Milo St
- 315 Killingly St
- 8 Milo St
- 291 Killingly St
- 9 Stanfield St
- 14 Milo St
- 15 Stanfield St
- 298 Killingly St
- 296 Killingly St
- 294 Killingly St
- 294 Killingly St Unit 1
- 323 Killingly St
- 18 Milo St
- 290 Killingly St
- 287 Killingly St
- 22 Milo St
- 284 Killingly St
- 286 Killingly St
- 10 Paolino St
- 11 Paolino St
Your Personal Tour Guide
Ask me questions while you tour the home.