Estimated Value: $298,555 - $321,000
3
Beds
2
Baths
1,193
Sq Ft
$260/Sq Ft
Est. Value
About This Home
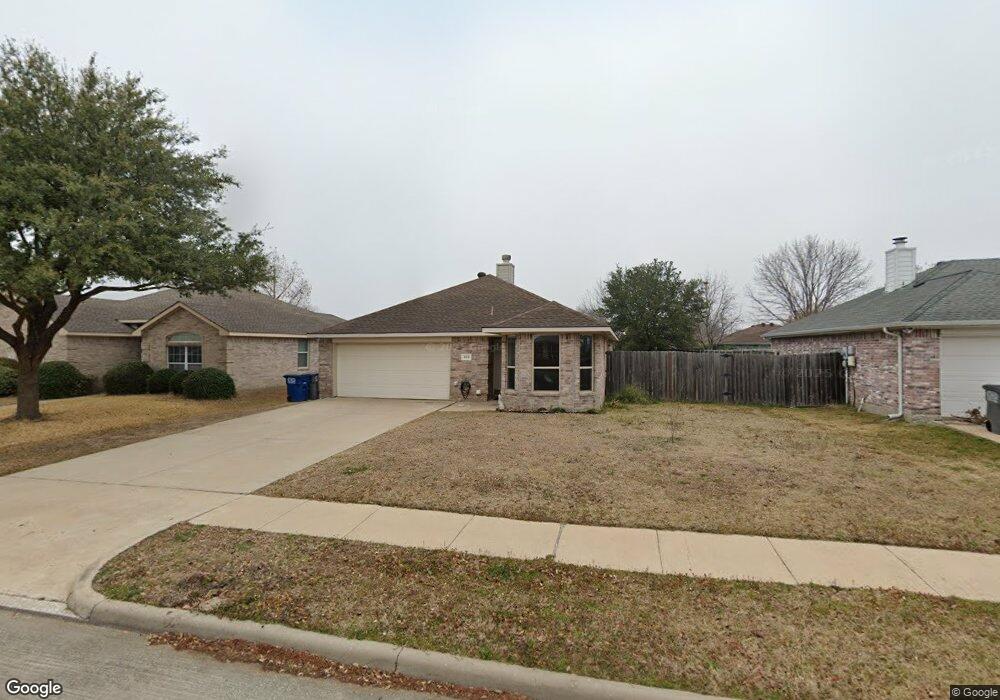
This home is located at 303 Lake Texoma Dr, Wylie, TX 75098 and is currently estimated at $310,139, approximately $259 per square foot. 303 Lake Texoma Dr is a home located in Collin County with nearby schools including Wally Watkins Elementary School, AB Harrison Intermediate School, and Grady Burnett J High School.
Ownership History
Date
Name
Owned For
Owner Type
Purchase Details
Closed on
Jul 24, 2019
Sold by
Smith Waymon Oneal and Butzke Kimberly Kay
Bought by
Smith Waymon O
Current Estimated Value
Purchase Details
Closed on
Jun 9, 2015
Sold by
Pena Adrian
Bought by
Lindstrom Cassandra Ann
Purchase Details
Closed on
Sep 3, 2002
Sold by
Choice Homes Inc
Bought by
Smith Waymon O and Smith Carey A
Home Financials for this Owner
Home Financials are based on the most recent Mortgage that was taken out on this home.
Original Mortgage
$112,064
Interest Rate
6.41%
Mortgage Type
FHA
Purchase Details
Closed on
Jun 11, 2002
Sold by
Twin Lakes Lp
Bought by
Choice Homes Inc
Home Financials for this Owner
Home Financials are based on the most recent Mortgage that was taken out on this home.
Original Mortgage
$10,000,000
Interest Rate
6.77%
Create a Home Valuation Report for This Property
The Home Valuation Report is an in-depth analysis detailing your home's value as well as a comparison with similar homes in the area
Home Values in the Area
Average Home Value in this Area
Purchase History
| Date | Buyer | Sale Price | Title Company |
|---|---|---|---|
| Smith Waymon O | -- | Servicelink | |
| Lindstrom Cassandra Ann | -- | None Available | |
| Smith Waymon O | -- | -- | |
| Choice Homes Inc | -- | -- |
Source: Public Records
Mortgage History
| Date | Status | Borrower | Loan Amount |
|---|---|---|---|
| Previous Owner | Smith Waymon O | $112,064 | |
| Previous Owner | Choice Homes Inc | $10,000,000 | |
| Closed | Lindstrom Cassandra Ann | $0 |
Source: Public Records
Tax History Compared to Growth
Tax History
| Year | Tax Paid | Tax Assessment Tax Assessment Total Assessment is a certain percentage of the fair market value that is determined by local assessors to be the total taxable value of land and additions on the property. | Land | Improvement |
|---|---|---|---|---|
| 2025 | $4,095 | $294,683 | $90,000 | $204,683 |
| 2024 | $4,095 | $272,128 | $80,000 | $214,283 |
| 2023 | $4,095 | $247,389 | $80,000 | $207,075 |
| 2022 | $4,934 | $224,899 | $80,000 | $179,602 |
| 2021 | $4,811 | $204,454 | $60,000 | $144,454 |
| 2020 | $4,851 | $195,357 | $60,000 | $135,357 |
| 2019 | $4,900 | $186,450 | $60,000 | $136,184 |
| 2018 | $4,565 | $169,500 | $50,000 | $129,717 |
| 2017 | $4,150 | $166,389 | $45,000 | $121,389 |
| 2016 | $3,892 | $142,740 | $33,000 | $109,740 |
| 2015 | $3,024 | $127,552 | $33,000 | $94,552 |
| 2014 | $3,024 | $115,771 | $0 | $0 |
Source: Public Records
Map
Nearby Homes
- 314 Lake Texoma Dr
- 800 Twin Oaks Dr
- 226 Shadybrook Dr
- 203 Forestbrook Dr
- Oakhaven Plan at Alanis Crossing
- Valencia Plan at Alanis Crossing
- 1306 Angel Fire Dr
- 217 Cloudcroft Dr
- 1500 Northwood Dr
- 109 Rockbrook Dr
- 414 Briarwood Dr
- 407 Stoneybrook Dr
- 401 Willow Way
- 416 S 1st St
- 307 Memorial Dr
- 416 Dogwood Dr
- 212 Colonial Dr
- 406 Willow Way
- 327 S 4th St
- 103 Cascade Ln
- 305 Lake Texoma Dr
- 301 Lake Texoma Dr
- 307 Lake Texoma Dr
- 302 Lake Wichita Dr
- 304 Lake Wichita Dr
- 306 Lake Wichita Dr
- 302 Lake Texoma Dr
- 309 Lake Texoma Dr
- 304 Lake Texoma Dr
- 300 Lake Texoma Dr
- 239 Lake Texoma Dr
- 306 Lake Texoma Dr
- 308 Lake Wichita Dr
- 238 Lake Wichita Dr
- 311 Lake Texoma Dr
- 308 Lake Texoma Dr
- 238 Lake Texoma Dr
- 237 Lake Texoma Dr
- 310 Lake Wichita Dr
- 303 Lake Wichita Dr