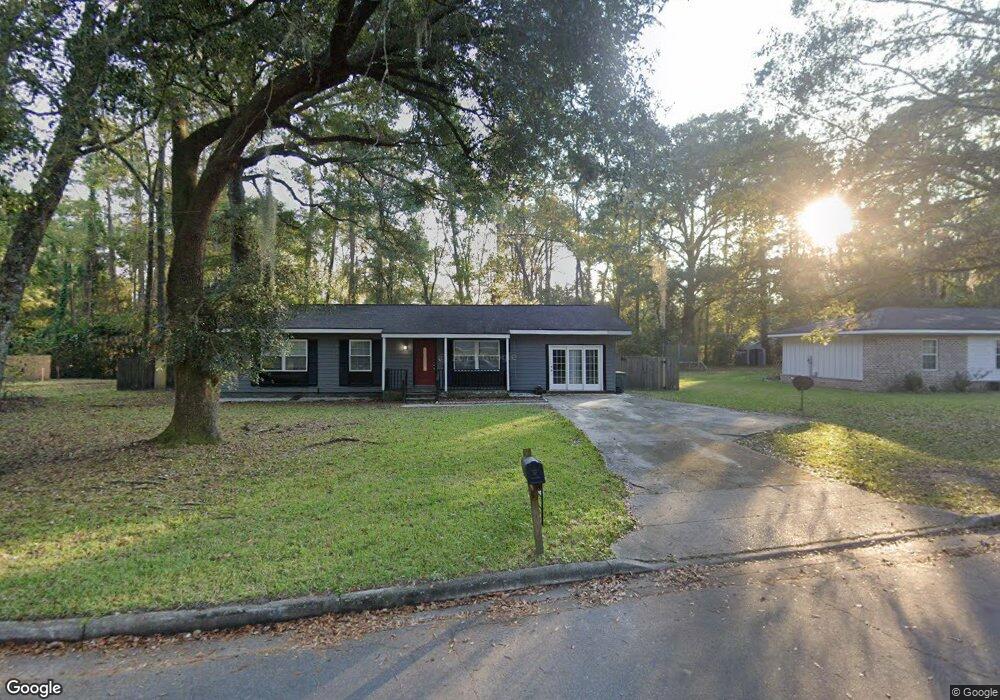
303 Layton St Hinesville, GA 31313
Estimated Value: $152,000 - $188,000
3
Beds
2
Baths
1,464
Sq Ft
$118/Sq Ft
Est. Value
About This Home
This home is located at 303 Layton St, Hinesville, GA 31313 and is currently estimated at $172,455, approximately $117 per square foot. 303 Layton St is a home located in Liberty County with nearby schools including Joseph Martin Elementary School, Midway Middle School, and Liberty County High School.
Ownership History
Date
Name
Owned For
Owner Type
Purchase Details
Closed on
Sep 28, 2022
Sold by
Moore Johnnie C
Bought by
Buddy Ventures Llc
Current Estimated Value
Purchase Details
Closed on
Mar 19, 2013
Sold by
Thomas Karyn
Bought by
Moore Johnnie C
Home Financials for this Owner
Home Financials are based on the most recent Mortgage that was taken out on this home.
Original Mortgage
$83,333
Interest Rate
3.3%
Mortgage Type
FHA
Purchase Details
Closed on
Nov 3, 2011
Sold by
Deutsche Bank National Trust Company
Bought by
Thomas Karyn
Purchase Details
Closed on
Apr 7, 2009
Sold by
Rayens Jason G
Bought by
Deutsche Bank National Trust Company
Purchase Details
Closed on
Nov 19, 2004
Sold by
Card Rose K
Bought by
Rayens Jason G
Purchase Details
Closed on
Jul 20, 1995
Bought by
Card Rose K
Purchase Details
Closed on
Sep 11, 1992
Bought by
Kupietz Joseph J
Create a Home Valuation Report for This Property
The Home Valuation Report is an in-depth analysis detailing your home's value as well as a comparison with similar homes in the area
Home Values in the Area
Average Home Value in this Area
Purchase History
| Date | Buyer | Sale Price | Title Company |
|---|---|---|---|
| Buddy Ventures Llc | $100,000 | -- | |
| Moore Johnnie C | $86,000 | -- | |
| Thomas Karyn | $33,000 | -- | |
| Deutsche Bank National Trust Company | $70,145 | -- | |
| Rayens Jason G | $82,900 | -- | |
| Card Rose K | $61,000 | -- | |
| Kupietz Joseph J | $54,500 | -- |
Source: Public Records
Mortgage History
| Date | Status | Borrower | Loan Amount |
|---|---|---|---|
| Previous Owner | Moore Johnnie C | $83,333 | |
| Previous Owner | Moore Johnnie C | $5,000 |
Source: Public Records
Tax History Compared to Growth
Tax History
| Year | Tax Paid | Tax Assessment Tax Assessment Total Assessment is a certain percentage of the fair market value that is determined by local assessors to be the total taxable value of land and additions on the property. | Land | Improvement |
|---|---|---|---|---|
| 2024 | $2,463 | $49,990 | $8,000 | $41,990 |
| 2023 | $2,463 | $45,524 | $8,000 | $37,524 |
| 2022 | $1,779 | $38,035 | $8,000 | $30,035 |
| 2021 | $1,370 | $28,656 | $4,200 | $24,456 |
| 2020 | $1,401 | $29,044 | $4,200 | $24,844 |
| 2019 | $1,409 | $29,431 | $4,200 | $25,231 |
| 2018 | $1,419 | $29,818 | $4,200 | $25,618 |
| 2017 | $995 | $30,205 | $4,200 | $26,005 |
| 2016 | $1,387 | $30,592 | $4,200 | $26,392 |
| 2015 | $1,475 | $30,592 | $4,200 | $26,392 |
| 2014 | $1,475 | $32,192 | $4,200 | $27,992 |
| 2013 | -- | $28,501 | $4,200 | $24,301 |
Source: Public Records
Map
Nearby Homes
- 514 Creekview Dr
- 411 Rogers Rd
- 606 Heritage Dr
- 407 Simpson St
- 1 Oglethorpe Ave
- 996 Stone Ct
- 601 Tupelo Trail Unit 42
- 402 W Oglethorpe Hwy
- 173 Ironwood Dr
- 24 Sherwood Dr
- 411 Woodland Dr
- 1.76 AC Tranquill Way
- 1.76 AC Shyam Dr
- 0 E General Stewart Way
- 205 Wilson Ave
- 148 Marron Way
- 980 Grayson Ave
- 804 Grayson Ave
- 864 Grayson Ave
- 1078 Grayson Ave
- 301 Layton St
- 305 Layton St
- 300 Layton St
- 304 Layton St
- 210 Layton St
- 500 Forest St
- 500 Heritage Dr
- 502 Layton Ct
- 502 Forest St
- 502 Heritage Dr
- 207 Fraser St
- 503 Layton Ct
- 504 Forest St
- 501 Heritage Dr
- 505 Layton Ct
- 504 Heritage Dr
- 0 Fraser St Unit 105128
- 0 Fraser St Unit 7030909
- 0 Fraser St Unit 7038579
- 0 Fraser St Unit 3163047