Estimated Value: $272,862 - $433,000
3
Beds
2
Baths
2,528
Sq Ft
$136/Sq Ft
Est. Value
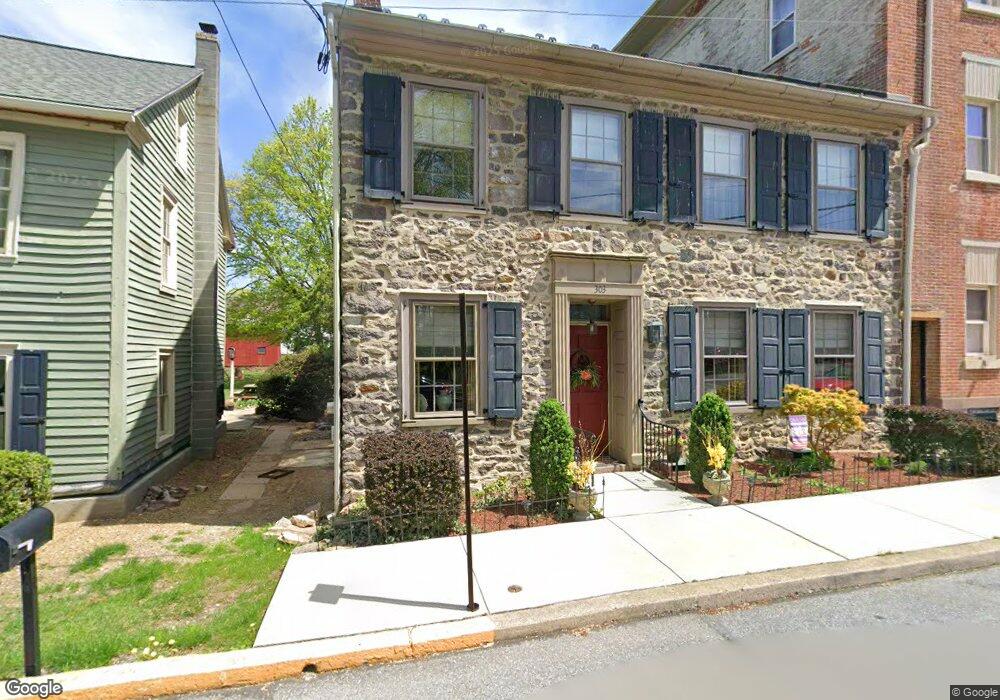
About This Home
This home is located at 303 Main St, Oley, PA 19547 and is currently estimated at $343,966, approximately $136 per square foot. 303 Main St is a home located in Berks County with nearby schools including Oley Valley Elementary School, Oley Valley Middle School, and Oley Valley Senior High School.
Ownership History
Date
Name
Owned For
Owner Type
Purchase Details
Closed on
Mar 29, 2007
Sold by
Strunk Howard L and Strunk Beth A
Bought by
Marsdale Alan F and Marsdale Karen E
Current Estimated Value
Home Financials for this Owner
Home Financials are based on the most recent Mortgage that was taken out on this home.
Original Mortgage
$150,000
Outstanding Balance
$91,588
Interest Rate
6.33%
Mortgage Type
New Conventional
Estimated Equity
$252,378
Create a Home Valuation Report for This Property
The Home Valuation Report is an in-depth analysis detailing your home's value as well as a comparison with similar homes in the area
Home Values in the Area
Average Home Value in this Area
Purchase History
| Date | Buyer | Sale Price | Title Company |
|---|---|---|---|
| Marsdale Alan F | $225,000 | First American Title Ins Co |
Source: Public Records
Mortgage History
| Date | Status | Borrower | Loan Amount |
|---|---|---|---|
| Open | Marsdale Alan F | $150,000 |
Source: Public Records
Tax History
| Year | Tax Paid | Tax Assessment Tax Assessment Total Assessment is a certain percentage of the fair market value that is determined by local assessors to be the total taxable value of land and additions on the property. | Land | Improvement |
|---|---|---|---|---|
| 2025 | $1,179 | $79,400 | $27,900 | $51,500 |
| 2024 | $3,427 | $79,400 | $27,900 | $51,500 |
| 2023 | $3,309 | $79,400 | $27,900 | $51,500 |
| 2022 | $3,246 | $79,400 | $27,900 | $51,500 |
| 2021 | $3,207 | $79,400 | $27,900 | $51,500 |
| 2020 | $3,159 | $79,400 | $27,900 | $51,500 |
| 2019 | $3,112 | $79,400 | $27,900 | $51,500 |
| 2018 | $3,072 | $79,400 | $27,900 | $51,500 |
| 2017 | $2,930 | $79,400 | $27,900 | $51,500 |
| 2016 | $836 | $79,400 | $27,900 | $51,500 |
| 2015 | $836 | $79,400 | $27,900 | $51,500 |
| 2014 | $836 | $79,400 | $27,900 | $51,500 |
Source: Public Records
Map
Nearby Homes
- 3284 Friedensburg Rd
- 0 Old State Rd
- 150 Water St
- 202 Water St
- 55 New Hope Blvd
- 129 Old State Rd
- 121 Old State Rd
- 20 Highland Dr
- 3 White Oak Dr
- 233 European Dr
- 18 Essig Dr
- 3211 Pricetown Rd
- 221 Hartman Rd
- 1018 Hartman Rd
- 120 Deysher Rd
- 108 Poplar Rd
- 1519 Friedensburg Rd
- 1220 Limekiln Rd
- 165 Wanner Rd
- 1190 Ritters Rd
Your Personal Tour Guide
Ask me questions while you tour the home.