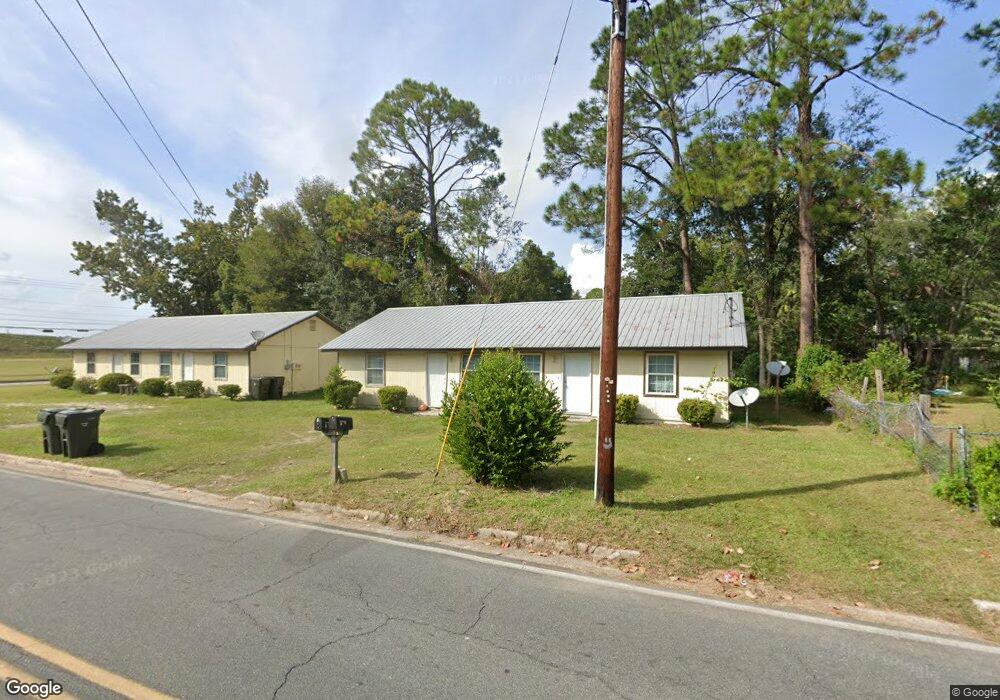
303 Marion St Waycross, GA 31501
Estimated Value: $97,000 - $117,000
8
Beds
4
Baths
2,700
Sq Ft
$40/Sq Ft
Est. Value
About This Home
This home is located at 303 Marion St, Waycross, GA 31501 and is currently estimated at $108,641, approximately $40 per square foot. 303 Marion St is a home located in Ware County with nearby schools including Ruskin Elementary School, Ware County Middle School, and Ware County High School.
Ownership History
Date
Name
Owned For
Owner Type
Purchase Details
Closed on
Aug 27, 2021
Sold by
Why Knot Investments Llc
Bought by
Toll Alberto and Toll Carmen Sylvia
Current Estimated Value
Purchase Details
Closed on
Jan 27, 2020
Sold by
Schlumbrecht Chad
Bought by
Why Knot Investments Llc
Purchase Details
Closed on
Sep 30, 2019
Sold by
Strickland Rental Properties Llc
Bought by
Schlumbrecht Chad
Purchase Details
Closed on
Jan 28, 2011
Sold by
Strickland Jacob T
Bought by
Strickland Rental Properties Llc
Purchase Details
Closed on
Aug 10, 1998
Sold by
Crosby Charles K and Crosby J
Bought by
Brumbeloe Ken P
Purchase Details
Closed on
Apr 5, 1997
Sold by
Henry Melonesse
Bought by
Crosby Charles K and Crosby J
Purchase Details
Closed on
Sep 13, 1996
Sold by
Crosby Charles K
Bought by
Henry Melonesse
Purchase Details
Closed on
Oct 20, 1995
Sold by
Lyons Samuel
Bought by
Crosby Charles K
Create a Home Valuation Report for This Property
The Home Valuation Report is an in-depth analysis detailing your home's value as well as a comparison with similar homes in the area
Home Values in the Area
Average Home Value in this Area
Purchase History
| Date | Buyer | Sale Price | Title Company |
|---|---|---|---|
| Toll Alberto | $125,000 | -- | |
| Why Knot Investments Llc | -- | -- | |
| Schlumbrecht Chad | $66,000 | -- | |
| Strickland Rental Properties Llc | -- | -- | |
| Brumbeloe Ken P | -- | -- | |
| Crosby Charles K | -- | -- | |
| Henry Melonesse | $40,000 | -- | |
| Crosby Charles K | -- | -- |
Source: Public Records
Tax History Compared to Growth
Tax History
| Year | Tax Paid | Tax Assessment Tax Assessment Total Assessment is a certain percentage of the fair market value that is determined by local assessors to be the total taxable value of land and additions on the property. | Land | Improvement |
|---|---|---|---|---|
| 2024 | $1,359 | $32,747 | $840 | $31,907 |
| 2023 | $1,129 | $14,122 | $1,568 | $12,554 |
| 2022 | $563 | $14,122 | $1,568 | $12,554 |
| 2021 | $541 | $12,522 | $1,568 | $10,954 |
| 2020 | $537 | $12,326 | $1,568 | $10,758 |
| 2019 | $454 | $10,272 | $1,568 | $8,704 |
| 2018 | $437 | $9,783 | $1,568 | $8,215 |
| 2017 | $487 | $9,783 | $1,568 | $8,215 |
| 2016 | $487 | $11,164 | $1,568 | $9,596 |
| 2015 | $490 | $11,164 | $1,568 | $9,596 |
| 2014 | $490 | $11,164 | $1,568 | $9,596 |
| 2013 | -- | $19,883 | $1,568 | $18,315 |
Source: Public Records
Map
Nearby Homes