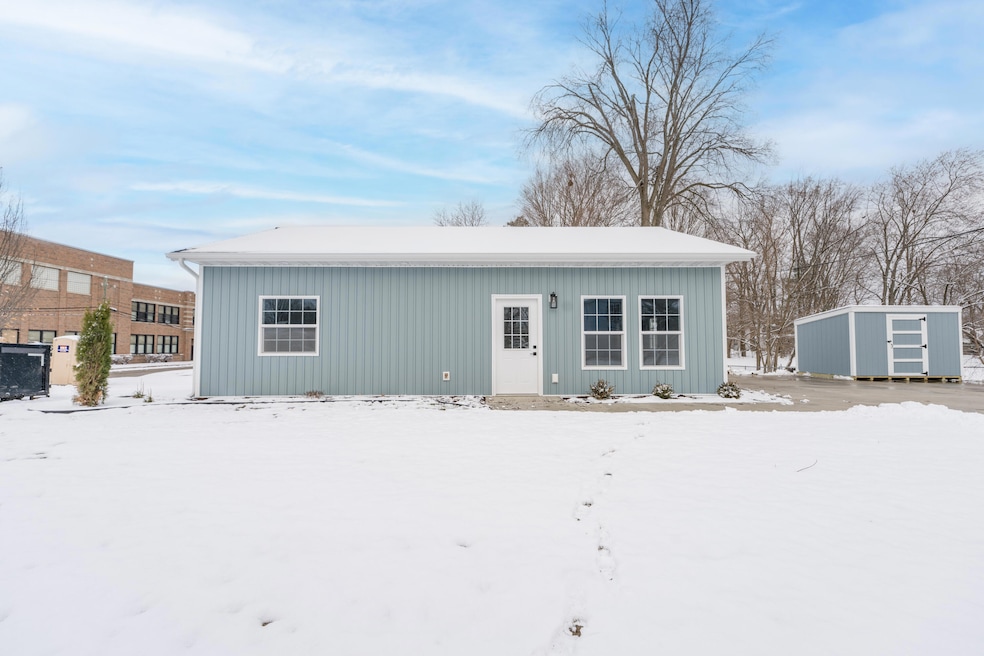
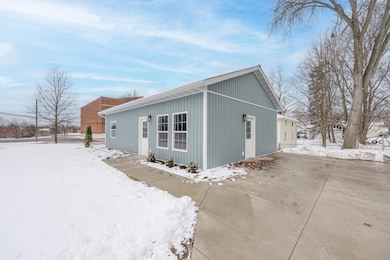
303 Middle St Three Rivers, MI 49093
Estimated payment $1,073/month
Highlights
- New Construction
- Eat-In Kitchen
- Laundry Room
- No HOA
- Living Room
- Dining Area
About This Home
Brand-New Construction — 303 Middle Street, Three Rivers
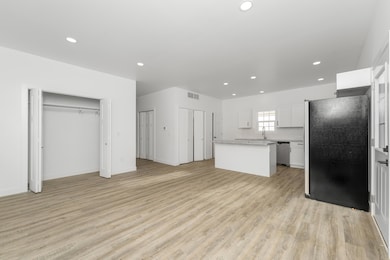
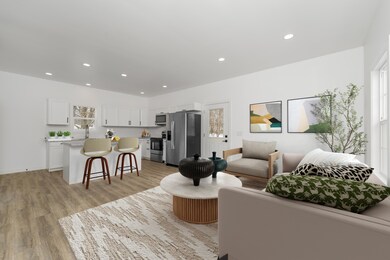
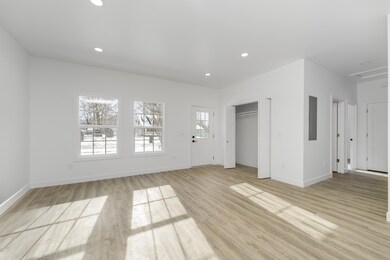
This beautifully built 2025 new construction home offers 2 bedrooms, 2 full baths, and 864 sq. ft. of modern, low-maintenance living. You'll enjoy this home's clean design, quality craftsmanship, and contemporary finishes.
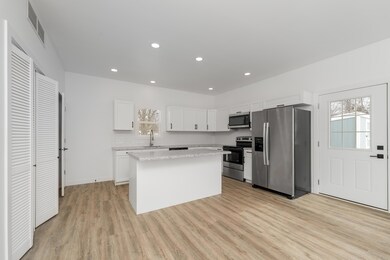
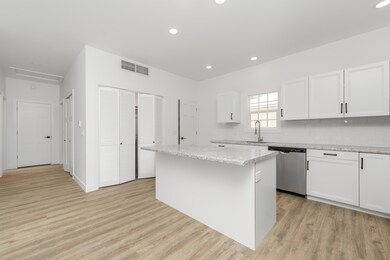
Step inside to an open floor plan that creates a bright, seamless flow between the living, dining, and kitchen spaces. The kitchen features crisp white cabinetry, a center island with eat-in seating, and all appliances included—refrigerator, stove, oven, microwave, dishwasher, washer, and dryer—making this home truly turn-key. The private primary bedroom includes an attached full bath, while the second full bathroom is conveniently located off the hallway near the additional bedroom.
Situated on a .21-acre lot, the property offers a manageable yard with room to enjoy outdoor activities. An exterior storage shed provides added convenience for tools, equipment, or seasonal items. A perfect choice for anyone seeking a modern, brand-new home with stylish finishes, thoughtful design, and effortless move-in convenience
Home Details
Home Type
- Single Family
Est. Annual Taxes
- $1,512
Year Built
- Built in 2025 | New Construction
Lot Details
- 9,148 Sq Ft Lot
- Lot Dimensions are 75x120
Home Design
- Slab Foundation
- Composition Roof
- Vinyl Siding
Interior Spaces
- 864 Sq Ft Home
- 1-Story Property
- Living Room
- Dining Area
- Vinyl Flooring
Kitchen
- Eat-In Kitchen
- Range
- Microwave
- Dishwasher
Bedrooms and Bathrooms
- 2 Main Level Bedrooms
- 2 Full Bathrooms
Laundry
- Laundry Room
- Laundry on main level
- Dryer
- Washer
Utilities
- Mini Split Air Conditioners
- Mini Split Heat Pump
Community Details
- No Home Owners Association
Map
Home Values in the Area
Average Home Value in this Area
Tax History
| Year | Tax Paid | Tax Assessment Tax Assessment Total Assessment is a certain percentage of the fair market value that is determined by local assessors to be the total taxable value of land and additions on the property. | Land | Improvement |
|---|---|---|---|---|
| 2025 | $1,243 | $31,900 | $4,400 | $27,500 |
| 2024 | $465 | $30,000 | $3,300 | $26,700 |
| 2023 | $443 | $23,800 | $2,800 | $21,000 |
| 2022 | $422 | $21,000 | $3,200 | $17,800 |
| 2021 | $621 | $20,100 | $3,200 | $16,900 |
| 2020 | $613 | $17,700 | $2,400 | $15,300 |
| 2019 | $602 | $15,900 | $2,400 | $13,500 |
| 2018 | $572 | $17,400 | $6,400 | $11,000 |
| 2017 | $563 | $17,100 | $17,100 | $0 |
| 2016 | -- | $16,700 | $16,700 | $0 |
| 2015 | -- | $14,100 | $0 | $0 |
| 2014 | -- | $13,400 | $13,400 | $0 |
| 2012 | -- | $12,700 | $12,700 | $0 |
Property History
| Date | Event | Price | List to Sale | Price per Sq Ft |
|---|---|---|---|---|
| 02/13/2026 02/13/26 | For Sale | $180,000 | 0.0% | $208 / Sq Ft |
| 01/19/2026 01/19/26 | Pending | -- | -- | -- |
| 12/01/2025 12/01/25 | For Sale | $180,000 | -- | $208 / Sq Ft |
Purchase History
| Date | Type | Sale Price | Title Company |
|---|---|---|---|
| Special Warranty Deed | $5,000 | None Listed On Document | |
| Warranty Deed | $5,000 | None Listed On Document | |
| Interfamily Deed Transfer | -- | Vt | |
| Deed | -- | -- | |
| Deed | -- | -- |
Mortgage History
| Date | Status | Loan Amount | Loan Type |
|---|---|---|---|
| Closed | $0 | Seller Take Back |
Source: MichRIC
MLS Number: 25060216
APN: 051-445-037-00
Disclaimer: Certain information contained herein is derived from information provided by parties other than Homes.com. All information provided is deemed reliable, but is not guaranteed to be accurate and should be independently verified.
![]() Information is deemed reliable but not guaranteed.
Information is deemed reliable but not guaranteed.
Copyright 2026 MichRIC, LLC. All rights reserved.
- 129 Middle St
- 111 River Dr
- 132 Middle St
- 108 River Dr
- 203 S Main St
- 11582 Michigan 60
- 416 River St
- 500 River St
- 816 River St
- 306 W Michigan Ave
- 522 Walnut St
- 503 East St
- 406 Spring St
- 210 W Bennett St
- 0 V L 13th and Cypress Ct
- v/l Portage Ave Unit 62
- 700 11th St
- 816 7th St
- 108 N Lincoln Ave
- 511 Maple St
- 435 Prospect St
- 484 Florence Rd
- 14250 Riverside Dr Unit B-2 Apt-2
- 345 Elm St
- 173 E Dibble St Unit 1
- 6452 W Vw Ave
- 521 N Spruce St Unit 2
- 155 Memorial Dr
- 69086 Texas Ave
- 2195 Captiva Island
- 8380 Greenspire Dr
- 3413 W Centre Ave
- 822 Shumway Ave
- 7914 Kilmory Cir
- 8032 Rowan St
- 7741 Walcott St
- 7725 Timbercreek Ct Unit 7725-2
- 1201 Snowapple Ave
- 1503 E Centre Ave
- 7640 Whispering Brook

Ask me questions while you tour the home.