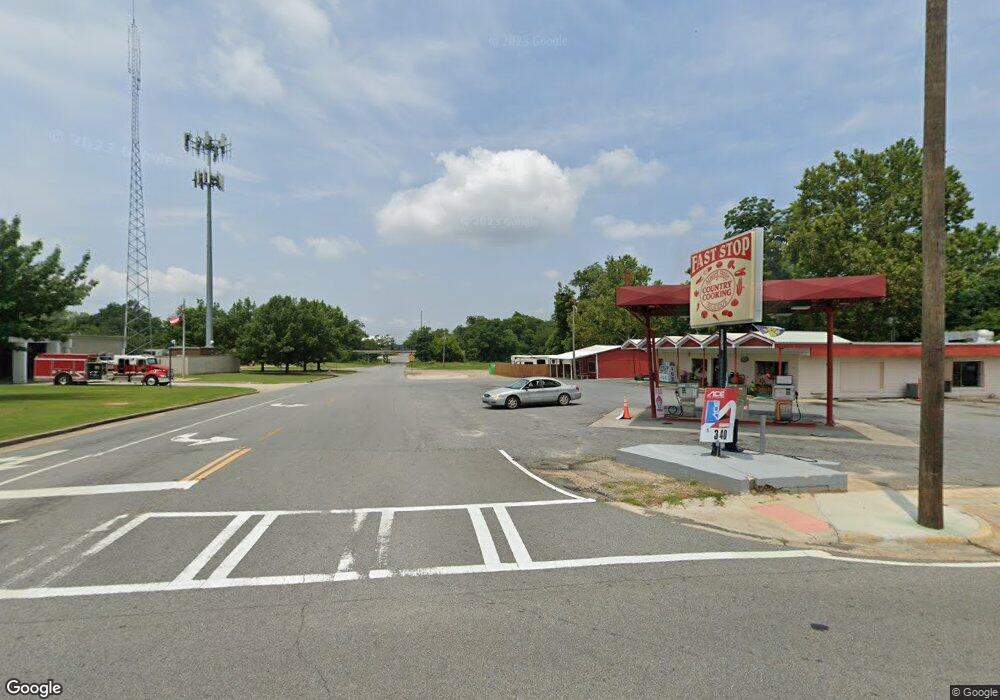
303 N 7th St Cordele, GA 31010
Estimated Value: $180,590
--
Bed
--
Bath
8,250
Sq Ft
$22/Sq Ft
Est. Value
About This Home
This home is located at 303 N 7th St, Cordele, GA 31010 and is currently estimated at $180,590, approximately $21 per square foot. 303 N 7th St is a home located in Crisp County with nearby schools including Crisp County Elementary School, Crisp County Primary School, and Crisp County Middle School.
Ownership History
Date
Name
Owned For
Owner Type
Purchase Details
Closed on
Aug 5, 2022
Sold by
Perry Brothers Oil Co Inc
Bought by
Arnett Sandra and Bailey Annette
Current Estimated Value
Purchase Details
Closed on
Aug 28, 2020
Sold by
Pitts Carroll W
Bought by
Perry Brothers Oil Co Inc
Purchase Details
Closed on
Jan 14, 2002
Sold by
Whipple Barbara Jean
Bought by
Pitts Carroll W
Create a Home Valuation Report for This Property
The Home Valuation Report is an in-depth analysis detailing your home's value as well as a comparison with similar homes in the area
Home Values in the Area
Average Home Value in this Area
Purchase History
| Date | Buyer | Sale Price | Title Company |
|---|---|---|---|
| Arnett Sandra | $165,000 | -- | |
| Perry Brothers Oil Co Inc | $185,000 | -- | |
| Pitts Carroll W | $38,000 | -- |
Source: Public Records
Tax History Compared to Growth
Tax History
| Year | Tax Paid | Tax Assessment Tax Assessment Total Assessment is a certain percentage of the fair market value that is determined by local assessors to be the total taxable value of land and additions on the property. | Land | Improvement |
|---|---|---|---|---|
| 2024 | $2,649 | $73,933 | $4,550 | $69,383 |
| 2023 | $2,772 | $73,933 | $4,550 | $69,383 |
| 2022 | $1,954 | $73,933 | $4,550 | $69,383 |
| 2021 | $1,915 | $73,933 | $4,550 | $69,383 |
| 2020 | $2,081 | $73,933 | $4,550 | $69,383 |
| 2019 | $2,319 | $73,933 | $4,550 | $69,383 |
| 2018 | $1,606 | $54,488 | $9,750 | $44,738 |
| 2017 | $2,213 | $54,488 | $9,750 | $44,738 |
| 2016 | $1,611 | $54,488 | $9,750 | $44,738 |
| 2015 | -- | $54,487 | $9,750 | $44,738 |
| 2014 | -- | $54,487 | $9,750 | $44,738 |
| 2013 | -- | $54,487 | $9,749 | $44,737 |
Source: Public Records
Map
Nearby Homes