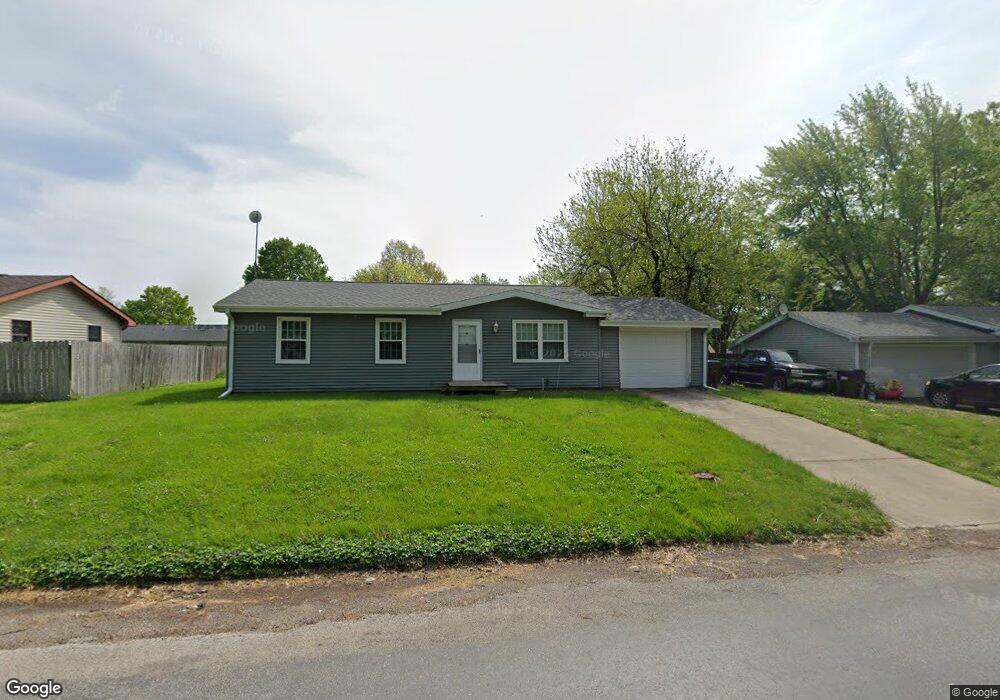
303 N Iris Dr Unit 1 Auburn, IL 62615
Estimated Value: $121,000 - $153,000
3
Beds
1
Bath
955
Sq Ft
$140/Sq Ft
Est. Value
About This Home
This home is located at 303 N Iris Dr Unit 1, Auburn, IL 62615 and is currently estimated at $134,069, approximately $140 per square foot. 303 N Iris Dr Unit 1 is a home located in Sangamon County with nearby schools including Auburn Elementary School, Auburn Middle School, and Auburn Junior High School.
Ownership History
Date
Name
Owned For
Owner Type
Purchase Details
Closed on
Nov 12, 2010
Current Estimated Value
Purchase Details
Closed on
Aug 18, 2008
Purchase Details
Closed on
May 15, 2007
Purchase Details
Closed on
Jan 26, 2007
Purchase Details
Closed on
Nov 13, 1997
Create a Home Valuation Report for This Property
The Home Valuation Report is an in-depth analysis detailing your home's value as well as a comparison with similar homes in the area
Home Values in the Area
Average Home Value in this Area
Purchase History
| Date | Buyer | Sale Price | Title Company |
|---|---|---|---|
| -- | -- | -- | |
| -- | $65,000 | -- | |
| -- | -- | -- | |
| -- | -- | -- | |
| -- | -- | -- |
Source: Public Records
Tax History Compared to Growth
Tax History
| Year | Tax Paid | Tax Assessment Tax Assessment Total Assessment is a certain percentage of the fair market value that is determined by local assessors to be the total taxable value of land and additions on the property. | Land | Improvement |
|---|---|---|---|---|
| 2024 | $1,279 | $36,141 | $7,328 | $28,813 |
| 2023 | $1,661 | $33,050 | $6,701 | $26,349 |
| 2022 | $1,537 | $31,291 | $6,344 | $24,947 |
| 2021 | $1,484 | $30,050 | $6,092 | $23,958 |
| 2020 | $1,482 | $29,945 | $6,071 | $23,874 |
| 2019 | $1,442 | $29,204 | $5,921 | $23,283 |
| 2018 | $1,409 | $28,601 | $5,799 | $22,802 |
| 2017 | $1,399 | $27,541 | $5,584 | $21,957 |
| 2016 | $1,343 | $27,369 | $5,549 | $21,820 |
| 2015 | $1,359 | $27,050 | $5,484 | $21,566 |
| 2014 | $1,363 | $27,470 | $5,569 | $21,901 |
| 2013 | $1,232 | $26,567 | $5,386 | $21,181 |
Source: Public Records
Map
Nearby Homes
- 406 N Iris Dr Unit 1
- 116 S Harris St
- 207 S Springfield St Unit 1
- 175 E Jackson St Unit 1
- 111 W Jefferson St
- 0 Illinois 104
- 13781 Gilmore Rd
- 4635 Dickey John Rd Unit 1
- 306 N Grand Ave
- 446 N 7th St Unit 1
- 206 S 8th St Unit 1
- 5145 W Divernon Rd Unit 1
- 201 S 3rd St Unit 1
- 74 Covered Bridge Acres Unit 1
- 11520 Wayside Meadows Rd
- 136 Post Rd Unit 1
- 18880 Perry Dr
- 5 Churchill Dr Unit 1
- 55 Buckingham Rd Unit 1
- 26 Circle
- 211 N Iris Dr Unit 1
- 307 N Iris Dr Unit 1
- 300 N Lily Ln Unit 1
- 208 N Lily Ln Unit 1
- 302 N Iris Dr Unit 1
- 210 N Iris Dr Unit 1
- 304 N Lily Ln
- 304 N Iris Dr
- 311 N Iris Dr Unit 1
- 207 N Iris Dr
- 204 N Lily Ln Unit 1
- 308 N Lily Ln Unit 1
- 206 N Iris Dr
- 310 N Iris Dr Unit 1
- 205 N Iris Dr Unit 1
- 301 N Rose Dr Unit 1
- 315 N Iris Dr Unit 1
- 305 N Rose Dr
- 209 N Rose Dr Unit 1
- 301 N Lily Ln Unit 1