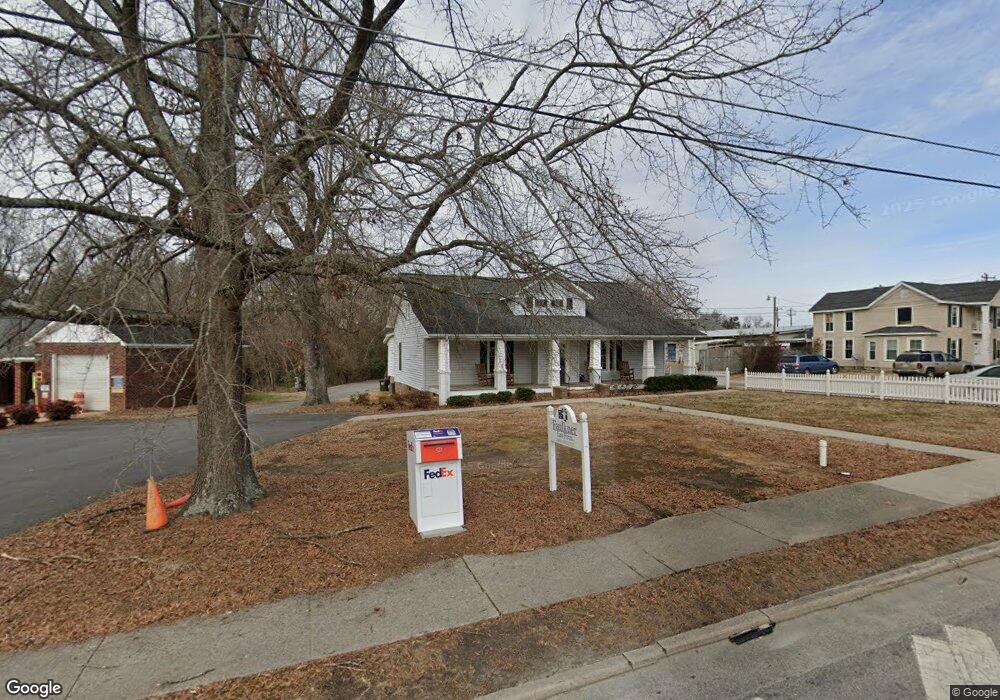
303 N Main St Clover, SC 29710
Estimated Value: $328,962
--
Bed
--
Bath
3,706
Sq Ft
$89/Sq Ft
Est. Value
About This Home
This home is located at 303 N Main St, Clover, SC 29710 and is currently estimated at $328,962, approximately $88 per square foot. 303 N Main St is a home located in York County with nearby schools including Kinard Elementary School, Clover Middle School, and Clover High School.
Ownership History
Date
Name
Owned For
Owner Type
Purchase Details
Closed on
Mar 27, 2018
Sold by
Haselden Alford and Owen James H
Bought by
Faulkner Thomas Alan and Faulkner Nellie Elizabeth Ramsey
Current Estimated Value
Home Financials for this Owner
Home Financials are based on the most recent Mortgage that was taken out on this home.
Original Mortgage
$160,000
Outstanding Balance
$45,298
Interest Rate
4.38%
Mortgage Type
New Conventional
Estimated Equity
$283,664
Purchase Details
Closed on
Oct 31, 2016
Sold by
Haselden Owen Boloyan & Corson Llc
Bought by
Haselden Alford and Owen James H
Purchase Details
Closed on
Jul 29, 2010
Sold by
Haselden and Owen
Bought by
Haselden Owen Boloyan & Corson Llc
Home Financials for this Owner
Home Financials are based on the most recent Mortgage that was taken out on this home.
Original Mortgage
$145,100
Interest Rate
4.61%
Mortgage Type
Commercial
Create a Home Valuation Report for This Property
The Home Valuation Report is an in-depth analysis detailing your home's value as well as a comparison with similar homes in the area
Home Values in the Area
Average Home Value in this Area
Purchase History
| Date | Buyer | Sale Price | Title Company |
|---|---|---|---|
| Faulkner Thomas Alan | $200,000 | None Available | |
| Haselden Alford | -- | None Available | |
| Haselden Owen Boloyan & Corson Llc | -- | -- | |
| Boloyan Myron B | $116,500 | -- |
Source: Public Records
Mortgage History
| Date | Status | Borrower | Loan Amount |
|---|---|---|---|
| Open | Faulkner Thomas Alan | $160,000 | |
| Previous Owner | Boloyan Myron B | $145,100 |
Source: Public Records
Tax History Compared to Growth
Tax History
| Year | Tax Paid | Tax Assessment Tax Assessment Total Assessment is a certain percentage of the fair market value that is determined by local assessors to be the total taxable value of land and additions on the property. | Land | Improvement |
|---|---|---|---|---|
| 2025 | $8,489 | $16,198 | $2,783 | $13,415 |
| 2024 | $7,244 | $14,085 | $3,000 | $11,085 |
| 2023 | $7,012 | $14,085 | $3,000 | $11,085 |
| 2022 | $6,462 | $14,085 | $3,000 | $11,085 |
| 2021 | -- | $14,085 | $3,000 | $11,085 |
| 2020 | $6,257 | $14,085 | $0 | $0 |
| 2019 | $6,325 | $13,530 | $0 | $0 |
| 2018 | $6,227 | $13,530 | $0 | $0 |
| 2017 | $5,978 | $13,530 | $0 | $0 |
| 2016 | $5,869 | $13,530 | $0 | $0 |
| 2014 | $6,050 | $13,530 | $3,000 | $10,530 |
| 2013 | $6,050 | $15,144 | $3,126 | $12,018 |
Source: Public Records
Map
Nearby Homes
- 221 N Main St
- 404 N Main St
- 603 Old North Main St
- 605 Old North Main St
- 113 Marion St
- 103 Fairview St
- 000 Oakland St
- 205 Kings Mountain St
- 203 Kings Mountain St
- 110 Orchard Dr
- 221 Kings Mountain St
- 107 Pressley St
- 303 Kings Mountain St
- 404 Guinn St
- 307 Kings Mountain St
- 812 Generation Ln
- 814 Generation Ln
- 201 Killian Cir
- 102 Wilson St
- 101 Ridge Ave