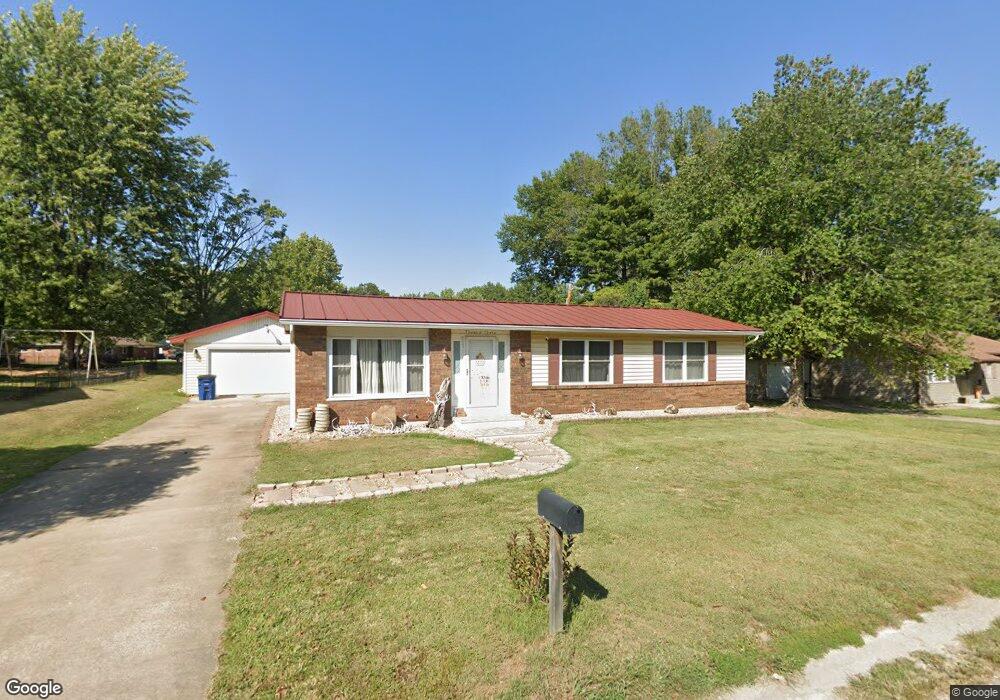
303 Peggy Ln Sparta, IL 62286
Estimated Value: $130,080 - $158,000
3
Beds
2
Baths
1,200
Sq Ft
$118/Sq Ft
Est. Value
About This Home
This home is located at 303 Peggy Ln, Sparta, IL 62286 and is currently estimated at $141,770, approximately $118 per square foot. 303 Peggy Ln is a home located in Randolph County with nearby schools including Sparta High School.
Ownership History
Date
Name
Owned For
Owner Type
Purchase Details
Closed on
Oct 16, 2025
Sold by
Baird Jeffery C and Baird Michelle E
Bought by
Kordys Andrew J and Kordys Brooke A
Current Estimated Value
Home Financials for this Owner
Home Financials are based on the most recent Mortgage that was taken out on this home.
Original Mortgage
$143,355
Outstanding Balance
$143,355
Interest Rate
6.63%
Mortgage Type
FHA
Estimated Equity
-$1,585
Purchase Details
Closed on
Apr 30, 2009
Sold by
Strange Gary and Strange Monica
Bought by
Baird Jeffery C and Baird Michelle E
Home Financials for this Owner
Home Financials are based on the most recent Mortgage that was taken out on this home.
Original Mortgage
$41,250
Interest Rate
5%
Mortgage Type
Purchase Money Mortgage
Create a Home Valuation Report for This Property
The Home Valuation Report is an in-depth analysis detailing your home's value as well as a comparison with similar homes in the area
Home Values in the Area
Average Home Value in this Area
Purchase History
| Date | Buyer | Sale Price | Title Company |
|---|---|---|---|
| Kordys Andrew J | $146,000 | None Listed On Document | |
| Baird Jeffery C | $55,000 | None Available |
Source: Public Records
Mortgage History
| Date | Status | Borrower | Loan Amount |
|---|---|---|---|
| Open | Kordys Andrew J | $143,355 | |
| Previous Owner | Baird Jeffery C | $41,250 |
Source: Public Records
Tax History Compared to Growth
Tax History
| Year | Tax Paid | Tax Assessment Tax Assessment Total Assessment is a certain percentage of the fair market value that is determined by local assessors to be the total taxable value of land and additions on the property. | Land | Improvement |
|---|---|---|---|---|
| 2024 | $3,004 | $37,670 | $2,915 | $34,755 |
| 2023 | $2,751 | $35,000 | $2,710 | $32,290 |
| 2022 | $2,793 | $35,445 | $3,155 | $32,290 |
| 2021 | $2,574 | $33,135 | $2,950 | $30,185 |
| 2020 | $2,431 | $33,934 | $3,022 | $30,912 |
| 2019 | $2,370 | $30,370 | $2,705 | $27,665 |
| 2018 | $2,349 | $33,483 | $2,982 | $30,501 |
| 2017 | $1,983 | $30,645 | $2,730 | $27,915 |
| 2016 | $2,075 | $29,530 | $2,630 | $26,900 |
| 2015 | $2,065 | $29,530 | $2,630 | $26,900 |
| 2014 | $2,065 | $30,105 | $2,680 | $27,425 |
| 2013 | $1,971 | $30,485 | $2,715 | $27,770 |
Source: Public Records
Map
Nearby Homes
- 115 W 4th St
- 255 Delwood Dr
- 410 S Saint Louis St
- 332 S Saint Louis St
- 321 S Market St
- 140&142 W Broadway
- 216 S Dickey St
- 336 W Jackson St
- 105 S Washington
- 500 S Chester St
- 540 E Broadway St
- 1019 E Main St
- 510 E Main St
- 715 W Broadway St
- 1019 E Broadway St
- 501 N Market St
- 712 E Harrison St
- 520 E Mound St
- 515 N Market St
- 35 Bogey Run