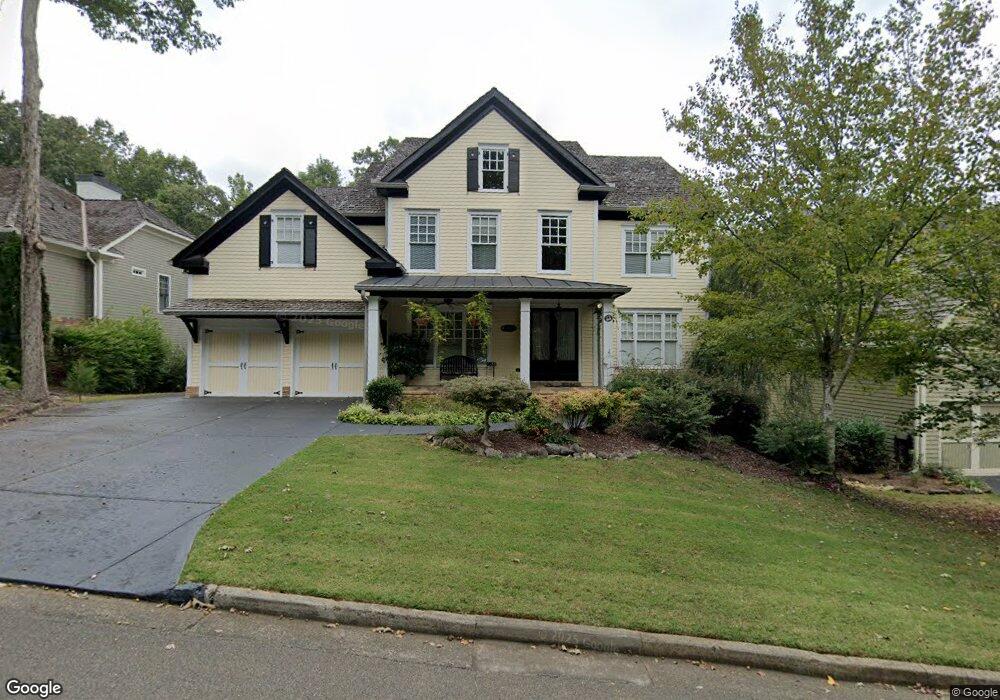
303 River Sound Ln Dawsonville, GA 30534
Dawson County NeighborhoodEstimated Value: $910,000 - $981,227
4
Beds
4
Baths
3,601
Sq Ft
$263/Sq Ft
Est. Value
About This Home
This home is located at 303 River Sound Ln, Dawsonville, GA 30534 and is currently estimated at $947,057, approximately $262 per square foot. 303 River Sound Ln is a home located in Dawson County with nearby schools including Kilough Elementary School, Dawson County Junior High School, and Dawson County Middle School.
Ownership History
Date
Name
Owned For
Owner Type
Purchase Details
Closed on
Apr 1, 2021
Sold by
Wieting Jancie
Bought by
Hatcher John H
Current Estimated Value
Purchase Details
Closed on
Aug 6, 2010
Sold by
Medendorp David and Medendorp Mary
Bought by
Hatcher John H and Hatcher Jancie S
Home Financials for this Owner
Home Financials are based on the most recent Mortgage that was taken out on this home.
Original Mortgage
$272,000
Interest Rate
4.6%
Mortgage Type
New Conventional
Purchase Details
Closed on
Apr 24, 2001
Sold by
H & F Homes Llc
Bought by
Medendorp David and Medendorp Mary C
Purchase Details
Closed on
Jan 22, 2001
Sold by
Highland Homes Inc
Bought by
H & F Homes Llc
Purchase Details
Closed on
Feb 9, 2000
Sold by
Chestatee Developmen
Bought by
Highland Homes Inc
Purchase Details
Closed on
Sep 27, 1996
Sold by
Noblin Edna
Bought by
Chestatee Developmen
Create a Home Valuation Report for This Property
The Home Valuation Report is an in-depth analysis detailing your home's value as well as a comparison with similar homes in the area
Home Values in the Area
Average Home Value in this Area
Purchase History
| Date | Buyer | Sale Price | Title Company |
|---|---|---|---|
| Hatcher John H | -- | None Available | |
| Hatcher John H | $340,000 | -- | |
| Medendorp David | $405,000 | -- | |
| H & F Homes Llc | $4,558,000 | -- | |
| Highland Homes Inc | $342,000 | -- | |
| Chestatee Developmen | $6,000,000 | -- |
Source: Public Records
Mortgage History
| Date | Status | Borrower | Loan Amount |
|---|---|---|---|
| Previous Owner | Hatcher John H | $272,000 |
Source: Public Records
Tax History Compared to Growth
Tax History
| Year | Tax Paid | Tax Assessment Tax Assessment Total Assessment is a certain percentage of the fair market value that is determined by local assessors to be the total taxable value of land and additions on the property. | Land | Improvement |
|---|---|---|---|---|
| 2024 | $4,728 | $292,840 | $38,000 | $254,840 |
| 2023 | $4,730 | $289,160 | $38,000 | $251,160 |
| 2022 | $4,926 | $229,960 | $30,000 | $199,960 |
| 2021 | $4,337 | $193,680 | $30,000 | $163,680 |
| 2020 | $4,275 | $182,680 | $24,000 | $158,680 |
| 2019 | $4,281 | $181,360 | $24,000 | $157,360 |
| 2018 | $4,290 | $181,360 | $24,000 | $157,360 |
| 2017 | $3,515 | $148,958 | $27,600 | $121,358 |
| 2016 | $3,521 | $149,230 | $27,600 | $121,630 |
| 2015 | $3,634 | $149,230 | $27,600 | $121,630 |
| 2014 | $3,377 | $134,513 | $27,600 | $106,913 |
| 2013 | -- | $124,470 | $25,500 | $98,970 |
Source: Public Records
Map
Nearby Homes
- 35 E Harbor Dr
- Manchester Plan at East Harbor II at Chestatee
- Leyland Plan at East Harbor II at Chestatee
- Scarlet Plan at East Harbor II at Chestatee
- 239 E Harbor Dr
- 25 River Sound Cir
- 194 E Harbor Dr
- 230 E Harbor Dr
- 206 E Harbor Dr
- 1070 Dogwood Way
- 110 Peninsula Way
- 472 River Overlook Rd
- 116 River Sound Alley
- 121 River Sound Alley
- 194 Waterfront Park Ln
- 37 Ridgetop Ct
- 648 Dogwood Way
- 95 Ridgetop Ct
- 233 Holly Dr
- 771 Night Fire Dr
- 315 River Sound Ln
- 291 River Sound Ln
- 337 River Sound Ln
- 265 River Sound Ln
- 249 River Sound Ln
- 280 River Sound Ln
- 260 River Sound Ln
- 237 River Sound Ln
- 52 Declan Pass
- 240 River Sound Ln
- 211 River Sound Ln
- 216 River Sound Ln
- 82 E Harbor Dr
- 83 Declan Pass
- 206 River Sound Ln
- 398 River Sound Ln
- 398 River Sound Ln Unit 673
- 73 Declan Pass
- 87 Declan Pass
- 192 River Sound Ln