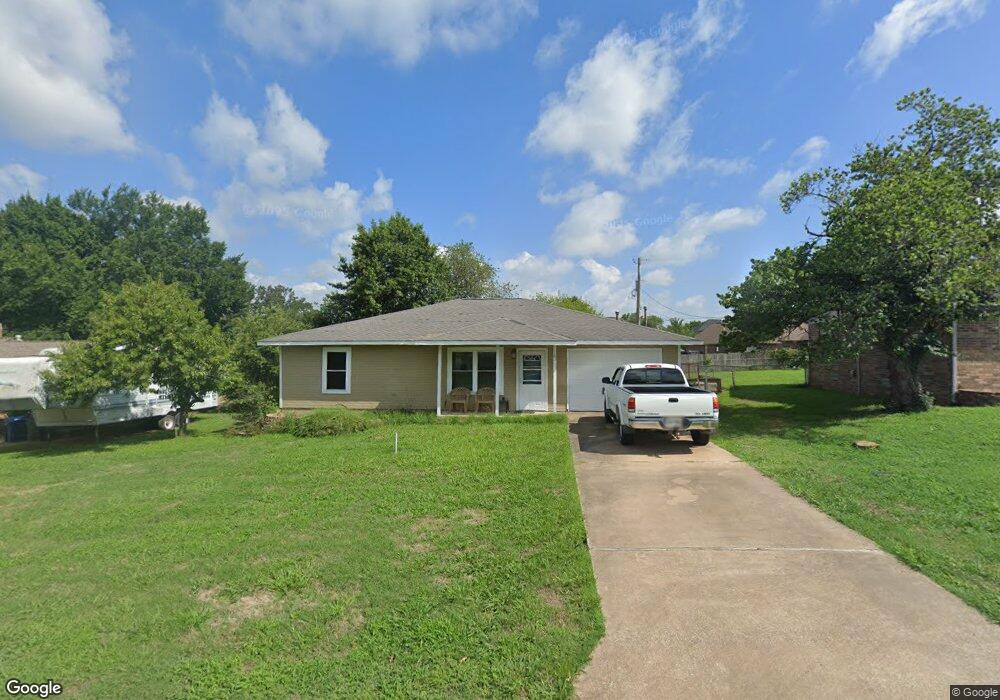
303 Roselawn St Siloam Springs, AR 72761
Estimated Value: $222,000 - $237,000
3
Beds
2
Baths
1,348
Sq Ft
$170/Sq Ft
Est. Value
About This Home
This home is located at 303 Roselawn St, Siloam Springs, AR 72761 and is currently estimated at $229,819, approximately $170 per square foot. 303 Roselawn St is a home located in Benton County with nearby schools including Northside Elementary School, Southside Elementary School, and Delbert Pete & Pat Allen Elementary School.
Ownership History
Date
Name
Owned For
Owner Type
Purchase Details
Closed on
Aug 24, 2010
Sold by
Green Julie D
Bought by
Green Ronald L
Current Estimated Value
Purchase Details
Closed on
Sep 10, 2004
Bought by
Green
Purchase Details
Closed on
Sep 2, 2004
Bought by
Green
Purchase Details
Closed on
Jul 14, 2004
Bought by
Mtg Elec
Purchase Details
Closed on
Jul 5, 2004
Bought by
Mtg Elec
Purchase Details
Closed on
Nov 10, 2003
Bought by
Hampton
Purchase Details
Closed on
Jan 5, 2001
Bought by
Hampton
Purchase Details
Closed on
Jun 7, 2000
Bought by
Ellis
Purchase Details
Closed on
Aug 1, 1997
Bought by
Mott
Purchase Details
Closed on
Jan 25, 1996
Bought by
Mott
Purchase Details
Closed on
Aug 28, 1985
Bought by
Mott
Purchase Details
Closed on
Jan 10, 1984
Bought by
Gorshe
Create a Home Valuation Report for This Property
The Home Valuation Report is an in-depth analysis detailing your home's value as well as a comparison with similar homes in the area
Home Values in the Area
Average Home Value in this Area
Purchase History
| Date | Buyer | Sale Price | Title Company |
|---|---|---|---|
| Green Ronald L | $2,500 | None Available | |
| Green | $73,000 | -- | |
| Green | $73,000 | -- | |
| Mtg Elec | -- | -- | |
| Mtg Elec | -- | -- | |
| Hampton | -- | -- | |
| Hampton | $77,000 | -- | |
| Ellis | $14,000 | -- | |
| Mott | -- | -- | |
| Albert | $215,000 | -- | |
| Mott | -- | -- | |
| Mott | $78,000 | -- | |
| Gorshe | $73,000 | -- |
Source: Public Records
Tax History Compared to Growth
Tax History
| Year | Tax Paid | Tax Assessment Tax Assessment Total Assessment is a certain percentage of the fair market value that is determined by local assessors to be the total taxable value of land and additions on the property. | Land | Improvement |
|---|---|---|---|---|
| 2025 | $938 | $38,900 | $8,400 | $30,500 |
| 2024 | $963 | $38,900 | $8,400 | $30,500 |
| 2023 | $963 | $27,160 | $7,200 | $19,960 |
| 2022 | $587 | $27,160 | $7,200 | $19,960 |
| 2021 | $584 | $27,160 | $7,200 | $19,960 |
| 2020 | $588 | $20,230 | $2,400 | $17,830 |
| 2019 | $588 | $20,230 | $2,400 | $17,830 |
| 2018 | $613 | $20,230 | $2,400 | $17,830 |
| 2017 | $613 | $20,230 | $2,400 | $17,830 |
| 2016 | $613 | $20,230 | $2,400 | $17,830 |
| 2015 | $963 | $18,110 | $1,600 | $16,510 |
| 2014 | $613 | $18,110 | $1,600 | $16,510 |
Source: Public Records
Map
Nearby Homes
- 2711 Summitt Dr
- 2503 Chanel St
- 2786 S Olive Ct
- 214 Lake Francis Dr
- 110 Cordes Dr
- 2210 E Fennec St
- 0 S Mount Olive St
- 0000 Elm St S
- 419 W Hannibal St
- 3214 S White Oak St
- 1413 E Emelyn Ln
- 820 W Deer Lodge Ct
- 3210 S Lincoln St
- 3408 S Lincoln St
- 3902 Short Ln
- 412 W Kenwood St
- 0 Tbd Hwy 412 W
- TBD W 412 Hwy
- 1218 E Kenwood St
- 0 S Carl St
- 309 Roselawn St
- 219 Roselawn St
- 607 Grand Ct
- 603 Grand Ct
- 313 Roselawn St
- 218 Roselawn St
- 609 Grand Ct
- 509 Grand Ct
- 2598 Summitt Dr
- 0 SE Summit Dr Unit 1025208
- 2405 Parkway St
- 610 Grand Ct
- 2700 Summitt Dr
- 606 Grand Ct
- 604 Grand Ct
- 507 Grand Ct
- 400 Roselawn St
- 602 Grand Ct
- Tbd Parkway St
- 608 Grand Ct