Estimated Value: $277,000 - $314,000
3
Beds
2
Baths
1,506
Sq Ft
$194/Sq Ft
Est. Value
About This Home
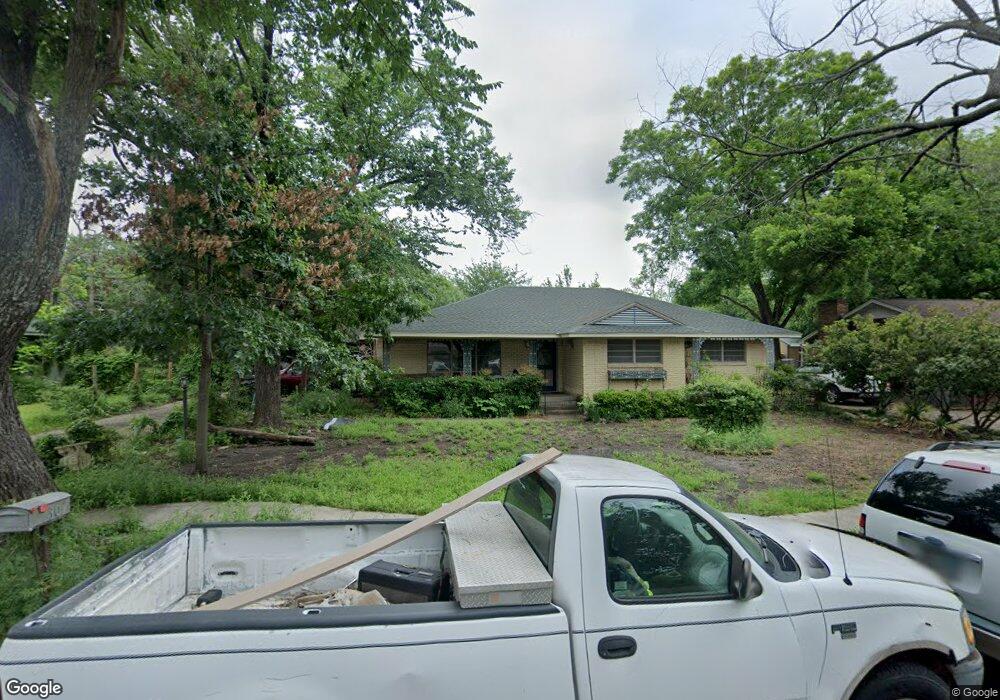
This home is located at 303 S 1st St, Wylie, TX 75098 and is currently estimated at $292,361, approximately $194 per square foot. 303 S 1st St is a home located in Collin County with nearby schools including R F Hartman Elementary School, AB Harrison Intermediate School, and Grady Burnett J High School.
Ownership History
Date
Name
Owned For
Owner Type
Purchase Details
Closed on
Mar 29, 2019
Sold by
Mm Finished Lots Iii Llc
Bought by
Siena Homes Llc
Current Estimated Value
Home Financials for this Owner
Home Financials are based on the most recent Mortgage that was taken out on this home.
Original Mortgage
$903,750
Interest Rate
4.3%
Mortgage Type
Purchase Money Mortgage
Purchase Details
Closed on
Nov 17, 1995
Sold by
Funk Gwen Mae
Bought by
Funk William Enoch
Purchase Details
Closed on
Mar 30, 1994
Sold by
Gibson William E and Gibson Barbara J
Bought by
Funk William E and Funk Gwen M
Home Financials for this Owner
Home Financials are based on the most recent Mortgage that was taken out on this home.
Original Mortgage
$67,619
Interest Rate
7.31%
Mortgage Type
FHA
Create a Home Valuation Report for This Property
The Home Valuation Report is an in-depth analysis detailing your home's value as well as a comparison with similar homes in the area
Home Values in the Area
Average Home Value in this Area
Purchase History
| Date | Buyer | Sale Price | Title Company |
|---|---|---|---|
| Siena Homes Llc | -- | Sendera Title | |
| Funk William Enoch | -- | -- | |
| Funk William E | -- | -- |
Source: Public Records
Mortgage History
| Date | Status | Borrower | Loan Amount |
|---|---|---|---|
| Previous Owner | Siena Homes Llc | $903,750 | |
| Previous Owner | Funk William E | $67,619 | |
| Closed | Funk William Enoch | $0 |
Source: Public Records
Tax History Compared to Growth
Tax History
| Year | Tax Paid | Tax Assessment Tax Assessment Total Assessment is a certain percentage of the fair market value that is determined by local assessors to be the total taxable value of land and additions on the property. | Land | Improvement |
|---|---|---|---|---|
| 2025 | $5,698 | $241,262 | $70,000 | $171,262 |
| 2024 | $5,698 | $288,489 | $70,000 | $218,489 |
| 2023 | $5,698 | $304,974 | $70,000 | $234,974 |
| 2022 | $6,393 | $291,389 | $60,000 | $231,389 |
| 2021 | $4,559 | $193,775 | $55,000 | $138,775 |
| 2020 | $4,435 | $178,622 | $40,000 | $138,622 |
| 2019 | $3,255 | $123,866 | $40,000 | $120,175 |
| 2018 | $3,033 | $112,605 | $40,000 | $110,784 |
| 2017 | $2,757 | $116,909 | $30,000 | $86,909 |
| 2016 | $2,586 | $93,062 | $15,000 | $78,062 |
| 2015 | $2,052 | $85,006 | $15,000 | $70,006 |
Source: Public Records
Map
Nearby Homes
- 329 S 2nd St
- 301 S 3rd St
- 702 S Ballard Ave
- 327 S 4th St
- 416 S 1st St
- 300 Woodhollow Ct
- 205 S Cottonbelt Ave
- 300 S Cottonbelt Ave Unit 3A
- 306 Woodhollow Ct
- 111 N Keefer Dr
- 1022 Debby Ct
- 416 Dogwood Dr
- 104 N 5th St
- 414 Briarwood Dr
- 303 N 2nd St
- 804 Memorial Dr
- 104 Rushcreek Dr
- 420 W Oak St
- 903 Mardi Gras Ln
- 404 W Jefferson St