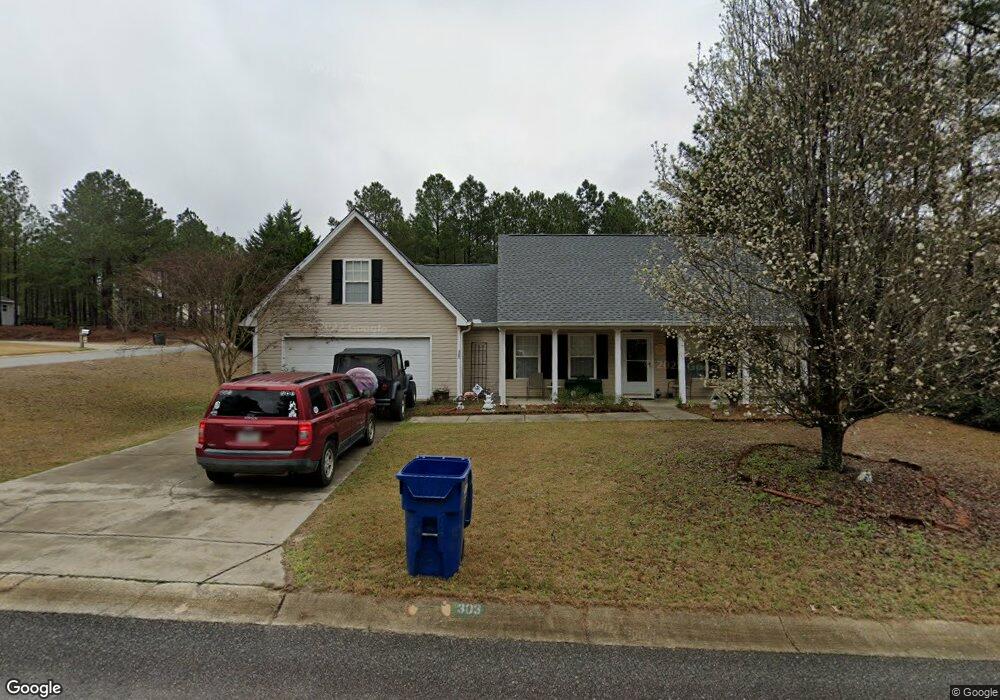
303 Siddington Way Lexington, SC 29073
Estimated Value: $244,000 - $290,000
3
Beds
2
Baths
1,903
Sq Ft
$142/Sq Ft
Est. Value
About This Home
This home is located at 303 Siddington Way, Lexington, SC 29073 and is currently estimated at $270,238, approximately $142 per square foot. 303 Siddington Way is a home located in Lexington County with nearby schools including Carolina Springs Elementary School, Carolina Springs Middle School, and White Knoll High School.
Ownership History
Date
Name
Owned For
Owner Type
Purchase Details
Closed on
Oct 5, 2018
Sold by
Timmerman Patrick A and Wilfond Jennifer K
Bought by
Wilfong Jennifer K and Wilfong Michael B
Current Estimated Value
Home Financials for this Owner
Home Financials are based on the most recent Mortgage that was taken out on this home.
Original Mortgage
$137,515
Outstanding Balance
$122,630
Interest Rate
5.62%
Mortgage Type
FHA
Estimated Equity
$147,608
Purchase Details
Closed on
Feb 15, 2010
Sold by
Timmerman Patrick A
Bought by
Wilfong Jennifer K
Purchase Details
Closed on
Oct 16, 2008
Sold by
Timmerman Michael P
Bought by
Timmerman Patrick A
Purchase Details
Closed on
Jun 15, 2005
Sold by
Johnson Patrick L and Johnson Cynthia J
Bought by
Timmerman Patrick A and Timmerman Michael P
Home Financials for this Owner
Home Financials are based on the most recent Mortgage that was taken out on this home.
Original Mortgage
$143,744
Interest Rate
5.66%
Mortgage Type
FHA
Create a Home Valuation Report for This Property
The Home Valuation Report is an in-depth analysis detailing your home's value as well as a comparison with similar homes in the area
Home Values in the Area
Average Home Value in this Area
Purchase History
| Date | Buyer | Sale Price | Title Company |
|---|---|---|---|
| Wilfong Jennifer K | -- | None Available | |
| Wilfong Jennifer K | -- | -- | |
| Timmerman Patrick A | -- | -- | |
| Timmerman Patrick A | $146,000 | -- |
Source: Public Records
Mortgage History
| Date | Status | Borrower | Loan Amount |
|---|---|---|---|
| Open | Wilfong Jennifer K | $137,515 | |
| Closed | Timmerman Patrick A | $143,744 |
Source: Public Records
Tax History Compared to Growth
Tax History
| Year | Tax Paid | Tax Assessment Tax Assessment Total Assessment is a certain percentage of the fair market value that is determined by local assessors to be the total taxable value of land and additions on the property. | Land | Improvement |
|---|---|---|---|---|
| 2024 | $944 | $6,317 | $1,000 | $5,317 |
| 2023 | $944 | $6,317 | $1,000 | $5,317 |
| 2020 | $965 | $6,317 | $1,000 | $5,317 |
| 2019 | $897 | $5,774 | $1,000 | $4,774 |
| 2018 | $880 | $5,774 | $1,000 | $4,774 |
| 2017 | $854 | $5,774 | $1,000 | $4,774 |
| 2016 | $846 | $5,773 | $1,000 | $4,773 |
| 2014 | $839 | $5,976 | $1,000 | $4,976 |
| 2013 | -- | $5,980 | $1,000 | $4,980 |
Source: Public Records
Map
Nearby Homes
- 212 Siddington Way
- 220 Socrates St
- 216 Socrates St
- 6343 Platt Springs Rd
- 472 Ridgehill Dr
- 416 Knotts Ct
- 105 Josie Ct
- 963 Sequoia Dr
- 311 Knotts Cir
- 947 Sequoia Dr
- 728 Leafy Bend Ct
- 129 Loyd Ct
- 217 Willow Forks Rd
- 167 Mesa Verde Dr
- 6104 Platt Springs Rd
- 305 Bridleridge Rd
- 712 Vanguard St
- 154 Dempsey Dr
- 244 Keegan Rock Ct
- 357 Longwood Dr
- 307 Siddington Way
- 140 Pepper Harrow Ln
- 137 Pepper Harrow Ln
- 315 Siddington Way
- 300 Siddington Way
- 304 Siddington Way
- 329 Siddington Way
- 291 Siddington Way
- 136 Pepper Harrow Ln
- 133 Pepper Harrow Ln
- 296 Siddington Way
- 335 Siddington Way
- 316 Siddington Way
- 292 Siddington Way
- 281 Siddington Way
- 320 Siddington Way
- 132 Pepper Harrow Ln
- 129 Pepper Harrow Ln
- 284 Siddington Way
- 341 Siddington Way