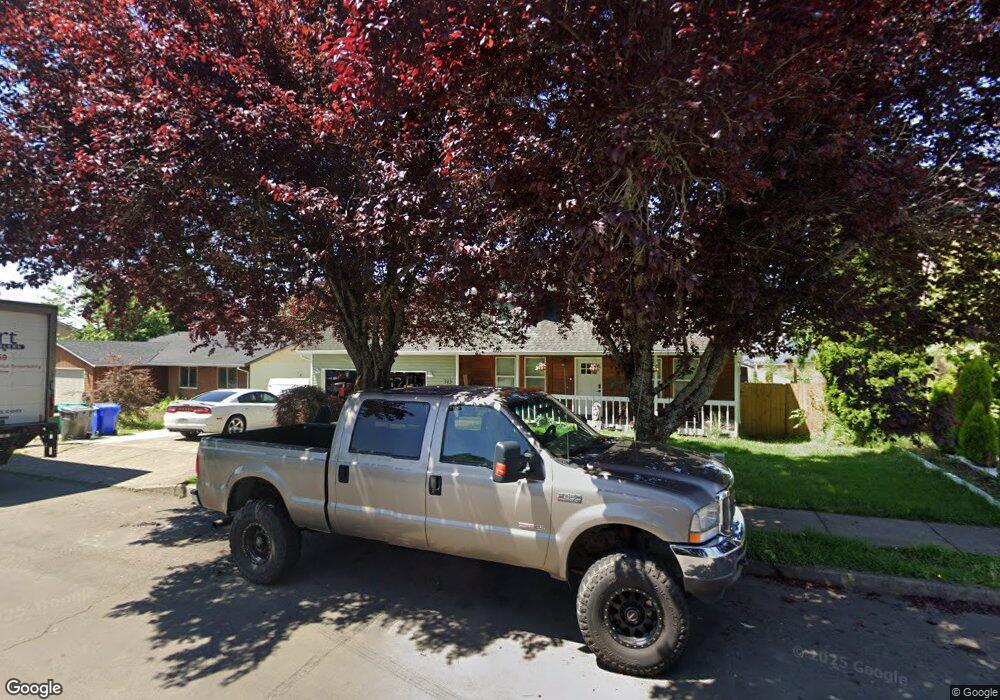
303 SW Riverview Ave Gresham, OR 97080
Hollybrook NeighborhoodEstimated Value: $412,000 - $474,000
4
Beds
2
Baths
1,579
Sq Ft
$284/Sq Ft
Est. Value
About This Home
This home is located at 303 SW Riverview Ave, Gresham, OR 97080 and is currently estimated at $448,552, approximately $284 per square foot. 303 SW Riverview Ave is a home located in Multnomah County with nearby schools including Hollydale Elementary School, Clear Creek Middle School, and Gresham High School.
Ownership History
Date
Name
Owned For
Owner Type
Purchase Details
Closed on
Jun 1, 2009
Sold by
Aurora Loan Services Llc
Bought by
Shackelford Lisa
Current Estimated Value
Home Financials for this Owner
Home Financials are based on the most recent Mortgage that was taken out on this home.
Original Mortgage
$165,938
Outstanding Balance
$104,955
Interest Rate
4.79%
Mortgage Type
FHA
Estimated Equity
$343,597
Purchase Details
Closed on
Feb 18, 2009
Sold by
Zelinski Heidi S
Bought by
Aurora Loan Services Llc
Purchase Details
Closed on
Feb 23, 1999
Sold by
Nitzke Tyler G
Bought by
Zelinski Heidi S
Home Financials for this Owner
Home Financials are based on the most recent Mortgage that was taken out on this home.
Original Mortgage
$137,650
Interest Rate
6.7%
Mortgage Type
Purchase Money Mortgage
Create a Home Valuation Report for This Property
The Home Valuation Report is an in-depth analysis detailing your home's value as well as a comparison with similar homes in the area
Home Values in the Area
Average Home Value in this Area
Purchase History
| Date | Buyer | Sale Price | Title Company |
|---|---|---|---|
| Shackelford Lisa | $169,000 | Fidelity Natl Title Co Of Or | |
| Aurora Loan Services Llc | $221,000 | Lex-Fidelity Natl Title Co | |
| Zelinski Heidi S | $144,900 | Fidelity National Title Co |
Source: Public Records
Mortgage History
| Date | Status | Borrower | Loan Amount |
|---|---|---|---|
| Open | Shackelford Lisa | $165,938 | |
| Previous Owner | Zelinski Heidi S | $137,650 |
Source: Public Records
Tax History
| Year | Tax Paid | Tax Assessment Tax Assessment Total Assessment is a certain percentage of the fair market value that is determined by local assessors to be the total taxable value of land and additions on the property. | Land | Improvement |
|---|---|---|---|---|
| 2025 | $5,127 | $251,940 | -- | -- |
| 2024 | $4,908 | $244,610 | -- | -- |
| 2023 | $4,908 | $237,490 | -- | -- |
| 2022 | $4,346 | $230,580 | $0 | $0 |
| 2021 | $4,237 | $223,870 | $0 | $0 |
| 2020 | $3,987 | $217,350 | $0 | $0 |
| 2019 | $3,882 | $211,020 | $0 | $0 |
| 2018 | $3,702 | $204,880 | $0 | $0 |
| 2017 | $3,552 | $198,920 | $0 | $0 |
| 2016 | $3,131 | $193,130 | $0 | $0 |
| 2015 | $3,064 | $187,510 | $0 | $0 |
| 2014 | $2,989 | $182,050 | $0 | $0 |
Source: Public Records
Map
Nearby Homes
- 44 SW Birdsdale Dr
- 21 NW Mawrcrest Ave
- 63 NW Mawrcrest Ave
- 85 NW Mawrcrest Ave
- 230 NW Mawrcrest Ave
- 236 NW Mawrcrest Ave
- 181 NW Mawrcrest Ave
- 256 NW Mawrcrest Ave
- 185 NW Mawrcrest Ave
- 284 NW Mawrcrest Ave
- 2095 NW 3rd St
- 2543 NW 2nd Terrace
- 2590 NW 2nd Terrace
- 1113 W Powell Blvd
- 159 SW Florence Ave Unit 64
- 159 SW Florence Ave
- 1175 SW Chastain Dr
- 1745 NW 7th Place
- 765 NW Angeline Ave
- 1960 SW 13th Ct
- 275 SW Riverview Ave
- 315 SW Riverview Ave
- 2008 SW 2nd Ct
- 324 SW Wonderview Dr
- 253 SW Riverview Ave
- 323 SW Riverview Ave
- 2017 SW 2nd Ct
- 302 SW Riverview Ave
- 270 SW Riverview Ave
- 2034 SW 2nd Ct
- 336 SW Wonderview Dr
- 252 SW Riverview Ave
- 225 SW Riverview Ave
- 335 SW Riverview Ave
- 2023 SW 2nd Ct
- 314 SW Riverview Ave
- 312 SW Wonderview Dr
- 2050 SW 2nd Ct
- 342 SW Riverview Ave
- 416 SW Wonderview Dr
Your Personal Tour Guide
Ask me questions while you tour the home.