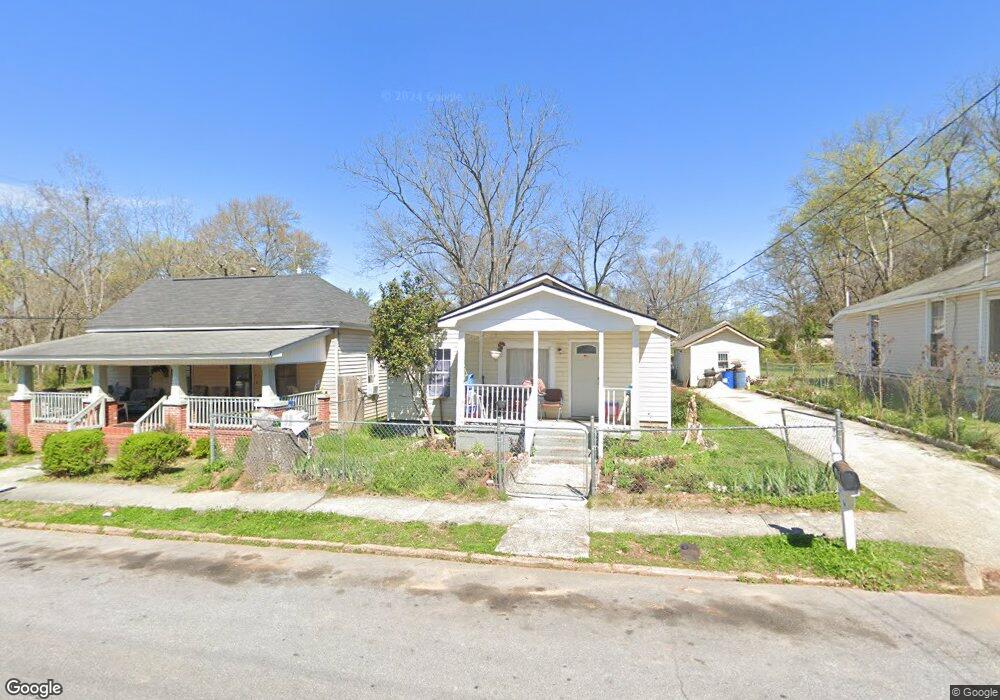
303 Thompson St Cedartown, GA 30125
Estimated Value: $108,702 - $186,000
3
Beds
2
Baths
1,447
Sq Ft
$103/Sq Ft
Est. Value
About This Home
This home is located at 303 Thompson St, Cedartown, GA 30125 and is currently estimated at $149,426, approximately $103 per square foot. 303 Thompson St is a home located in Polk County with nearby schools including Cedar Christian School and Vineyard Harvester Christian Academy.
Ownership History
Date
Name
Owned For
Owner Type
Purchase Details
Closed on
Dec 30, 2010
Sold by
Orr Nicholas Anthony
Bought by
Gomez-Luax Ramiro
Current Estimated Value
Home Financials for this Owner
Home Financials are based on the most recent Mortgage that was taken out on this home.
Original Mortgage
$21,250
Outstanding Balance
$14,278
Interest Rate
4.48%
Mortgage Type
New Conventional
Estimated Equity
$135,148
Purchase Details
Closed on
Sep 25, 2009
Sold by
Orr Nicholas Anthony and Reid Deborah L
Bought by
Orr Nicholas Anthony and Reid Deboarh L
Purchase Details
Closed on
Aug 2, 2009
Sold by
Orr Robert A
Bought by
Reid Deborah L
Purchase Details
Closed on
Jun 14, 2002
Sold by
Brentson Hazel
Bought by
Orr Robert A
Purchase Details
Closed on
May 13, 1992
Sold by
Mcgregor Catherine Y
Bought by
Brentson Hazel M
Purchase Details
Closed on
May 12, 1950
Bought by
Mcgregor Catherine
Create a Home Valuation Report for This Property
The Home Valuation Report is an in-depth analysis detailing your home's value as well as a comparison with similar homes in the area
Home Values in the Area
Average Home Value in this Area
Purchase History
| Date | Buyer | Sale Price | Title Company |
|---|---|---|---|
| Gomez-Luax Ramiro | $25,000 | -- | |
| Gomez-Luax Ramiro | $25,000 | -- | |
| Orr Nicholas Anthony | -- | -- | |
| Reid Deborah L | -- | -- | |
| Orr Robert A | $20,000 | -- | |
| Brentson Hazel M | -- | -- | |
| Mcgregor Catherine | -- | -- |
Source: Public Records
Mortgage History
| Date | Status | Borrower | Loan Amount |
|---|---|---|---|
| Open | Gomez-Luax Ramiro | $21,250 | |
| Closed | Gomez-Luax Ramiro | $21,250 |
Source: Public Records
Tax History Compared to Growth
Tax History
| Year | Tax Paid | Tax Assessment Tax Assessment Total Assessment is a certain percentage of the fair market value that is determined by local assessors to be the total taxable value of land and additions on the property. | Land | Improvement |
|---|---|---|---|---|
| 2024 | $928 | $30,690 | $6,000 | $24,690 |
| 2023 | $698 | $21,498 | $374 | $21,124 |
| 2022 | $388 | $18,348 | $374 | $17,974 |
| 2021 | $393 | $18,348 | $374 | $17,974 |
| 2020 | $394 | $18,348 | $374 | $17,974 |
| 2019 | $464 | $19,277 | $1,015 | $18,262 |
| 2018 | $457 | $18,602 | $870 | $17,732 |
| 2017 | $452 | $18,602 | $870 | $17,732 |
| 2016 | $315 | $13,590 | $870 | $12,720 |
| 2015 | $373 | $13,654 | $870 | $12,784 |
| 2014 | $375 | $13,654 | $870 | $12,784 |
Source: Public Records
Map
Nearby Homes
- 226 Central St
- 129 Thompson St
- 217 E Gibson St
- 427 Park St
- 729 S College St
- 328 330 Stubbs
- 537 Fletcher St
- 0 Philpot Springs Unit 10626665
- 129 W Ellawood Ave
- 151 W Ellawood Ave
- 234 Brooks St
- 208 Highland Ave
- 634 Georgia Ave
- 634 Georgia Ave Unit 123
- 149 Irwin St
- 00 Juliette St
- 2460 Hidden Creek Rd
- 328 Mountain Home Rd
- 601 Mountain Home Rd
- 325 Fairview Ave
- 307 Thompson St
- 301 Thompson St
- 233 Thompson St
- 315 Thompson St
- 302 Thompson St
- 310 Central St
- 314 Central St
- 229 Thompson St
- 306 Central St
- 302 Central St
- 304 Thompson St
- 306 Thompson St
- 308 Thompson St
- 310 Thompson St
- 318 Central St
- 230 Central St
- 314 Thompson St
- 325 Thompson St
- 232 Thompson St
- 318 Thompson St