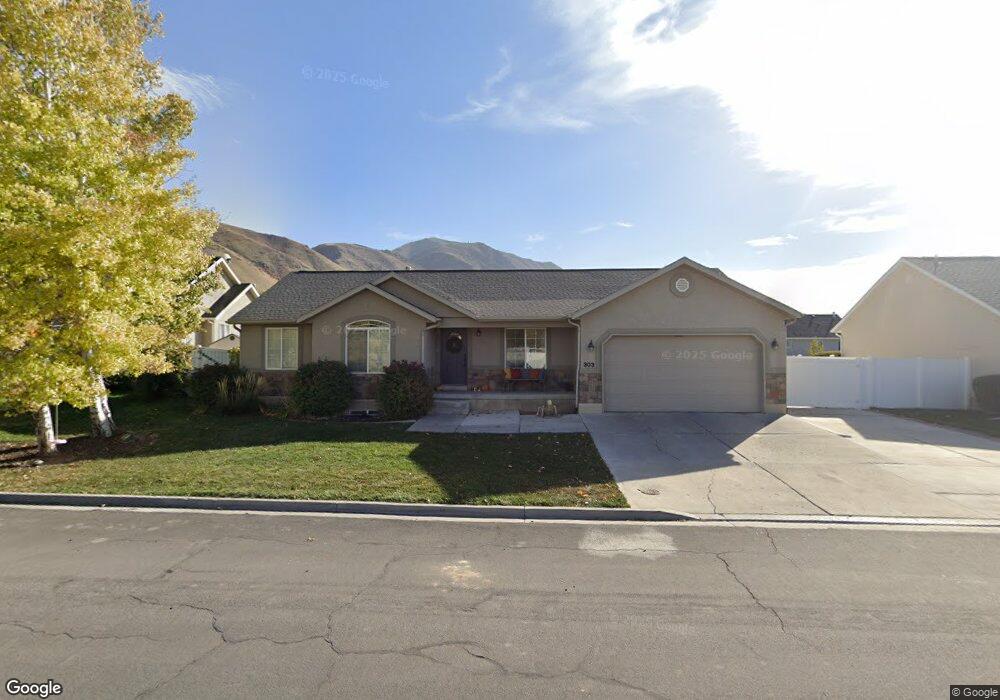
303 W 1600 S Unit 27 Payson, UT 84651
Estimated Value: $510,000 - $541,964
3
Beds
4
Baths
1,467
Sq Ft
$356/Sq Ft
Est. Value
About This Home
This home is located at 303 W 1600 S Unit 27, Payson, UT 84651 and is currently estimated at $522,241, approximately $355 per square foot. 303 W 1600 S Unit 27 is a home located in Utah County with nearby schools including Spring Lake Elementary, Payson High School, and Payson Junior High School.
Ownership History
Date
Name
Owned For
Owner Type
Purchase Details
Closed on
Dec 29, 2014
Sold by
Roblin James Brock and Roblin Marissa A
Bought by
Billings Adam and Billings Rebecca
Current Estimated Value
Home Financials for this Owner
Home Financials are based on the most recent Mortgage that was taken out on this home.
Original Mortgage
$160,000
Outstanding Balance
$123,093
Interest Rate
3.96%
Mortgage Type
New Conventional
Estimated Equity
$399,148
Purchase Details
Closed on
Sep 17, 2004
Sold by
Dayton Bradly S
Bought by
Roblin James Brock and Roblin Marissa A
Purchase Details
Closed on
Mar 11, 2003
Sold by
Dayton Tiffany W
Bought by
Dayton Bradly S
Home Financials for this Owner
Home Financials are based on the most recent Mortgage that was taken out on this home.
Original Mortgage
$167,000
Interest Rate
5.12%
Create a Home Valuation Report for This Property
The Home Valuation Report is an in-depth analysis detailing your home's value as well as a comparison with similar homes in the area
Home Values in the Area
Average Home Value in this Area
Purchase History
We collect this data history from publicly available records. To have your information removed, we recommend requesting removal directly through your county’s website.
| Date | Buyer | Sale Price | Title Company |
|---|---|---|---|
| Billings Adam | -- | First American Title Co Llc | |
| Roblin James Brock | -- | Horizon Title Insurance | |
| Dayton Bradly S | -- | Horizon Title |
Source: Public Records
Mortgage History
We collect this data history from publicly available records. To have your information removed, we recommend requesting removal directly through your county’s website.
| Date | Status | Borrower | Loan Amount |
|---|---|---|---|
| Open | Billings Adam | $160,000 | |
| Previous Owner | Dayton Bradly S | $167,000 |
Source: Public Records
Tax History
| Year | Tax Paid | Tax Assessment Tax Assessment Total Assessment is a certain percentage of the fair market value that is determined by local assessors to be the total taxable value of land and additions on the property. | Land | Improvement |
|---|---|---|---|---|
| 2025 | $2,538 | $281,270 | -- | -- |
| 2024 | $2,543 | $258,335 | $0 | $0 |
| 2023 | $2,543 | $259,490 | $0 | $0 |
| 2022 | $2,760 | $277,035 | $0 | $0 |
| 2021 | $2,340 | $376,700 | $114,100 | $262,600 |
| 2020 | $2,220 | $349,600 | $103,700 | $245,900 |
| 2019 | $1,911 | $308,600 | $85,800 | $222,800 |
| 2018 | $1,751 | $272,500 | $75,100 | $197,400 |
| 2017 | $1,579 | $132,165 | $0 | $0 |
| 2016 | $1,474 | $122,595 | $0 | $0 |
| 2015 | $1,323 | $109,285 | $0 | $0 |
| 2014 | $1,166 | $96,965 | $0 | $0 |
Source: Public Records
Map
Nearby Homes
- 299 W 1500 S
- 44 W 1690 S
- 609 W Saddlebrook Dr
- 245 W 1770 S
- 598 W Saddlebrook Dr
- 456 W 1820 S
- 1835 S 410 W
- 1848 S 100 E Unit 3
- 1852 S 100 E Unit 4
- 1403 S 600 W
- 1873 S 240 W
- 1872 S 100 E Unit 6
- 1886 S 500 W
- 1529 S 780 W
- 1428 S 730 W
- 1589 S 840 W
- 802 Brookside Ct
- 582 E 1250 S Unit 137
- 1405 S 780 W
- 802 Sugar Maple Ct
Your Personal Tour Guide
Ask me questions while you tour the home.