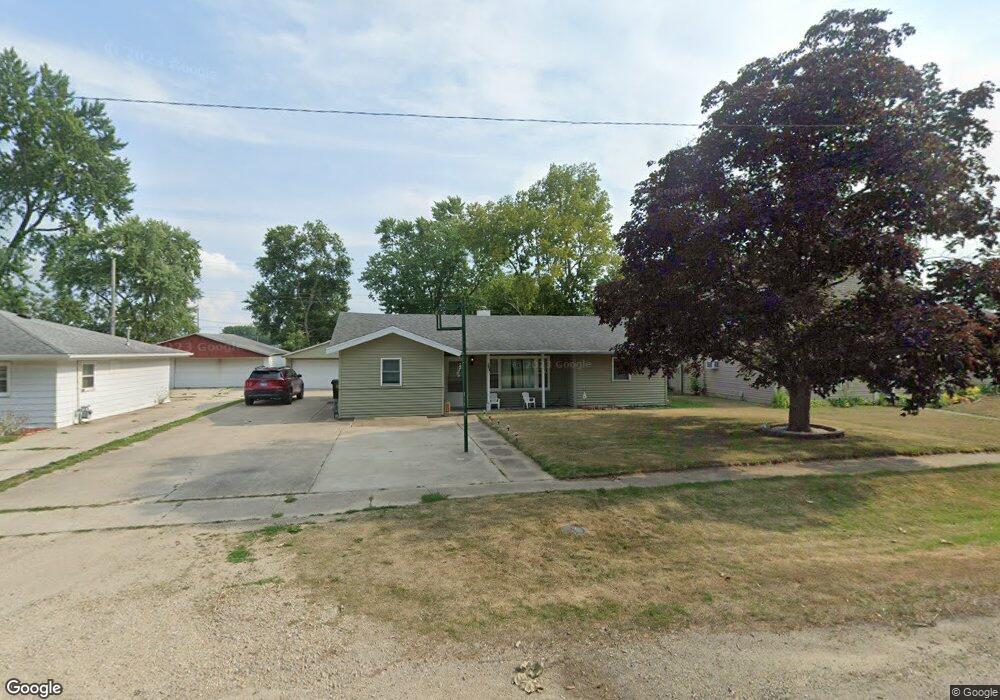
303 W 20th St Rock Falls, IL 61071
Estimated Value: $98,901 - $118,000
--
Bed
--
Bath
--
Sq Ft
8,712
Sq Ft Lot
About This Home
This home is located at 303 W 20th St, Rock Falls, IL 61071 and is currently estimated at $106,975. 303 W 20th St is a home located in Whiteside County with nearby schools including Dillon Elementary School, Merrill Elementary School, and Rock Falls Middle School.
Ownership History
Date
Name
Owned For
Owner Type
Purchase Details
Closed on
Aug 5, 2022
Sold by
Brebner David R
Bought by
Taylor Esther
Current Estimated Value
Purchase Details
Closed on
Mar 1, 2006
Sold by
Community State Bank Of Rock Falls
Bought by
Taylor Meza Esther
Home Financials for this Owner
Home Financials are based on the most recent Mortgage that was taken out on this home.
Original Mortgage
$44,936
Interest Rate
7.5%
Mortgage Type
Seller Take Back
Create a Home Valuation Report for This Property
The Home Valuation Report is an in-depth analysis detailing your home's value as well as a comparison with similar homes in the area
Home Values in the Area
Average Home Value in this Area
Purchase History
| Date | Buyer | Sale Price | Title Company |
|---|---|---|---|
| Taylor Esther | -- | Pignatelli & Associates Pc | |
| Taylor Meza Esther | $47,000 | None Available |
Source: Public Records
Mortgage History
| Date | Status | Borrower | Loan Amount |
|---|---|---|---|
| Previous Owner | Taylor Meza Esther | $44,936 |
Source: Public Records
Tax History Compared to Growth
Tax History
| Year | Tax Paid | Tax Assessment Tax Assessment Total Assessment is a certain percentage of the fair market value that is determined by local assessors to be the total taxable value of land and additions on the property. | Land | Improvement |
|---|---|---|---|---|
| 2024 | $3,243 | $29,568 | $3,565 | $26,003 |
| 2023 | $3,059 | $27,269 | $3,288 | $23,981 |
| 2022 | $2,938 | $25,411 | $3,100 | $22,311 |
| 2021 | $2,826 | $24,041 | $2,933 | $21,108 |
| 2020 | $2,829 | $23,630 | $2,883 | $20,747 |
| 2019 | $2,679 | $22,785 | $2,780 | $20,005 |
| 2018 | $2,506 | $22,277 | $2,718 | $19,559 |
| 2017 | $2,505 | $21,859 | $2,667 | $19,192 |
| 2016 | $1,772 | $21,491 | $2,622 | $18,869 |
| 2015 | $1,781 | $22,575 | $2,755 | $19,820 |
| 2014 | $1,757 | $21,972 | $2,681 | $19,291 |
| 2013 | $1,781 | $22,575 | $2,755 | $19,820 |
Source: Public Records
Map
Nearby Homes