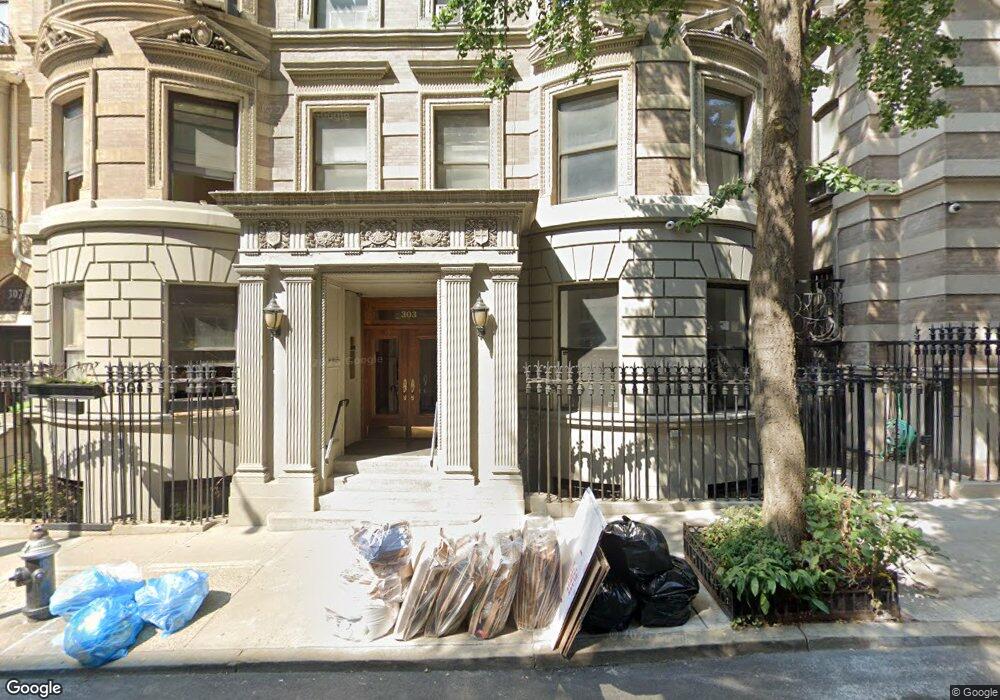
303 W 80th St Unit 3D305 New York, NY 10024
Upper West Side NeighborhoodEstimated Value: $908,000 - $1,126,000
--
Bed
--
Bath
750
Sq Ft
$1,336/Sq Ft
Est. Value
About This Home
This home is located at 303 W 80th St Unit 3D305, New York, NY 10024 and is currently estimated at $1,001,740, approximately $1,335 per square foot. 303 W 80th St Unit 3D305 is a home located in New York County with nearby schools including P.S. 9 Sarah Anderson, Harlem Link Charter School, and Gillen Brewer School.
Ownership History
Date
Name
Owned For
Owner Type
Purchase Details
Closed on
Nov 20, 2003
Sold by
Daley Laura E and Schall Alexander G
Bought by
Guez Stephane
Current Estimated Value
Home Financials for this Owner
Home Financials are based on the most recent Mortgage that was taken out on this home.
Original Mortgage
$400,000
Outstanding Balance
$184,925
Interest Rate
5.96%
Mortgage Type
Purchase Money Mortgage
Estimated Equity
$816,815
Purchase Details
Closed on
Jun 8, 2001
Sold by
Beiser Morton
Bought by
Schall Alexander G and Daley Laura E
Home Financials for this Owner
Home Financials are based on the most recent Mortgage that was taken out on this home.
Original Mortgage
$375,000
Interest Rate
7.16%
Mortgage Type
Purchase Money Mortgage
Purchase Details
Closed on
Oct 30, 1997
Sold by
Norman Lynn
Bought by
Beiser Morton
Create a Home Valuation Report for This Property
The Home Valuation Report is an in-depth analysis detailing your home's value as well as a comparison with similar homes in the area
Home Values in the Area
Average Home Value in this Area
Purchase History
| Date | Buyer | Sale Price | Title Company |
|---|---|---|---|
| Guez Stephane | $535,000 | -- | |
| Schall Alexander G | -- | -- | |
| Beiser Morton | $260,000 | Commonwealth Land Title Ins |
Source: Public Records
Mortgage History
| Date | Status | Borrower | Loan Amount |
|---|---|---|---|
| Open | Guez Stephane | $400,000 | |
| Previous Owner | Schall Alexander G | $375,000 |
Source: Public Records
Tax History Compared to Growth
Tax History
| Year | Tax Paid | Tax Assessment Tax Assessment Total Assessment is a certain percentage of the fair market value that is determined by local assessors to be the total taxable value of land and additions on the property. | Land | Improvement |
|---|---|---|---|---|
| 2025 | $12,026 | $98,025 | $29,965 | $68,060 |
| 2024 | $12,026 | $96,191 | $29,965 | $66,226 |
| 2023 | $9,519 | $94,054 | $29,965 | $64,089 |
| 2022 | $9,256 | $91,699 | $29,965 | $61,734 |
| 2021 | $11,249 | $91,699 | $29,965 | $61,734 |
| 2020 | $9,571 | $100,745 | $29,965 | $70,780 |
| 2019 | $9,057 | $94,015 | $29,965 | $64,050 |
| 2018 | $10,084 | $94,416 | $29,964 | $64,452 |
| 2017 | $9,409 | $88,398 | $29,965 | $58,433 |
| 2016 | $8,795 | $87,486 | $29,965 | $57,521 |
| 2015 | $4,934 | $77,346 | $29,965 | $47,381 |
| 2014 | $4,934 | $76,853 | $29,964 | $46,889 |
Source: Public Records
Map
Nearby Homes
- 425 W End Ave Unit 5B
- 425 W End Ave Unit 3A
- 303 W 80th St Unit 2B1B
- 303 W 80th St Unit 2A
- 411 W End Ave Unit 18D
- 401 W End Ave Unit 3AB
- 400 W End Ave Unit 8B
- 400 W End Ave Unit 1D
- 400 W End Ave Unit 2B
- 400 W End Ave Unit 13A
- 400 W End Ave Unit 13CD
- 440 W End Ave Unit 12A
- 440 W End Ave Unit 8F
- 90 Riverside Dr Unit PENTHOUSEA
- 90 Riverside Dr Unit 14A
- 90 Riverside Dr Unit 16E
- 250 W 81st St Unit 7-B
- 450 W End Ave Unit 3B
- 393 W End Ave Unit 6-F
- 393 W End Ave Unit 1D
- 303 W 80th St Unit 6D305
- 303 W 80th St Unit 5D305
- 303 W 80th St Unit 4D305
- 303 W 80th St Unit 2D305
- 303 W 80th St Unit 1D305
- 303 W 80th St Unit 6C305
- 303 W 80th St Unit 5C305
- 303 W 80th St Unit 4C305
- 303 W 80th St Unit 3C305
- 303 W 80th St Unit 2C305
- 303 W 80th St Unit 1C305
- 303 W 80th St Unit 6B305
- 303 W 80th St Unit 5B305
- 303 W 80th St Unit 4B305
- 303 W 80th St Unit 3B305
- 303 W 80th St Unit 2B305
- 303 W 80th St Unit 1B305
- 303 W 80th St Unit 6A305
- 303 W 80th St Unit 5A305
- 303 W 80th St Unit 4A305