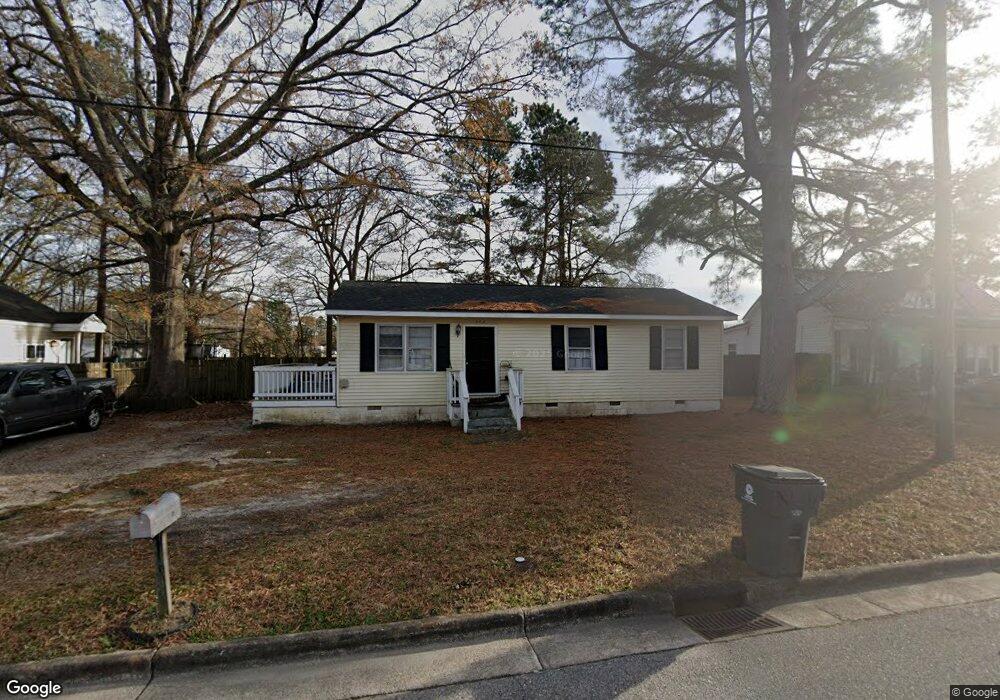
303 W Horton St Zebulon, NC 27597
Estimated Value: $170,000 - $227,000
3
Beds
2
Baths
936
Sq Ft
$212/Sq Ft
Est. Value
About This Home
This home is located at 303 W Horton St, Zebulon, NC 27597 and is currently estimated at $198,341, approximately $211 per square foot. 303 W Horton St is a home located in Wake County with nearby schools including Wakelon Elementary School, Zebulon Magnet Middle School, and East Wake High School.
Ownership History
Date
Name
Owned For
Owner Type
Purchase Details
Closed on
Nov 23, 2016
Sold by
His Capital Investment Group Llc
Bought by
Slipstream Rtp Real Estate 1 Llc
Current Estimated Value
Purchase Details
Closed on
Apr 5, 2010
Sold by
His Capital Investment Group Llc
Bought by
Green Brenda
Purchase Details
Closed on
Jul 13, 2009
Sold by
Secretary Of Housing & Urban Development
Bought by
His Capital Investment Group Llc
Purchase Details
Closed on
Dec 1, 2008
Sold by
Ambritz Amadeo S and Ambritz Celina Espinoza
Bought by
Secretary Of Housing & Urban Development
Purchase Details
Closed on
Jun 19, 2000
Sold by
Satterwhite Myrtle M and Satterwhite Harvey
Bought by
Ambritz Amadeo Simon and Ambritz Celina Espinoza
Home Financials for this Owner
Home Financials are based on the most recent Mortgage that was taken out on this home.
Original Mortgage
$6,048
Interest Rate
8.27%
Create a Home Valuation Report for This Property
The Home Valuation Report is an in-depth analysis detailing your home's value as well as a comparison with similar homes in the area
Home Values in the Area
Average Home Value in this Area
Purchase History
| Date | Buyer | Sale Price | Title Company |
|---|---|---|---|
| Slipstream Rtp Real Estate 1 Llc | $65,000 | None Available | |
| Green Brenda | $60,000 | None Available | |
| His Capital Investment Group Llc | -- | None Available | |
| Secretary Of Housing & Urban Development | $115,182 | None Available | |
| Ambritz Amadeo Simon | $75,000 | -- | |
| Satterwhite Myrtle M | -- | -- | |
| Murray Ricky | -- | -- |
Source: Public Records
Mortgage History
| Date | Status | Borrower | Loan Amount |
|---|---|---|---|
| Previous Owner | Murray Ricky | $6,048 | |
| Previous Owner | Murray Ricky | $74,949 | |
| Closed | Green Brenda | $0 |
Source: Public Records
Tax History Compared to Growth
Tax History
| Year | Tax Paid | Tax Assessment Tax Assessment Total Assessment is a certain percentage of the fair market value that is determined by local assessors to be the total taxable value of land and additions on the property. | Land | Improvement |
|---|---|---|---|---|
| 2025 | $1,650 | $149,015 | $30,000 | $119,015 |
| 2024 | $1,645 | $149,015 | $30,000 | $119,015 |
| 2023 | $1,370 | $109,571 | $26,000 | $83,571 |
| 2022 | $1,329 | $109,571 | $26,000 | $83,571 |
| 2021 | $1,280 | $109,571 | $26,000 | $83,571 |
| 2020 | $1,280 | $109,571 | $26,000 | $83,571 |
| 2019 | $1,081 | $80,845 | $17,838 | $63,007 |
| 2018 | $1,028 | $80,845 | $17,838 | $63,007 |
| 2017 | $982 | $80,845 | $17,838 | $63,007 |
| 2016 | $970 | $80,845 | $17,838 | $63,007 |
| 2015 | $937 | $80,434 | $17,697 | $62,737 |
| 2014 | $907 | $80,434 | $17,697 | $62,737 |
Source: Public Records
Map
Nearby Homes
- 410 W Horton St
- 212 W Sycamore St Unit A And B
- 220 W Barbee St
- 406 N Wakefield St
- 1016 Bolton Pointe Dr
- 1024 Bolton Pointe Dr
- 1624 Briar Brook Ln
- 1032 Bolton Pointe Dr
- 405 N Arendell Ave
- 512 W Franklin St
- 501 Somerset Dr
- 117 E Glenn St Unit A
- 513 Derby Place
- 301 Pony Rd
- 516 Barrington Row Ave
- 15 Bella Ln
- 160 Eason Farm Dr
- 30 Bella Ln
- 55 Gumtop Dr
- 310 E Horton St
- 107 N Wakefield St
- 105 N Wakefield St
- 305 W Horton St
- 203 N Wakefield St
- 00000 W Horton St
- W W Horton St
- 0 W Horton St
- 316 W Horton St
- 307 & 309 W Horton St
- 225 W Horton St
- 309 W Horton St
- 307 and 30 W Horton St
- 307 and 309 W Horton St
- 114 N Wakefield St
- 221 W Horton St
- 308 W Horton St
- 260 W Vance St
- 311 W Horton St
- 101 N Wakefield St
- 202 N Wakefield St