Estimated Value: $140,523 - $210,000
4
Beds
1
Bath
--
Sq Ft
6,011
Sq Ft Lot
About This Home
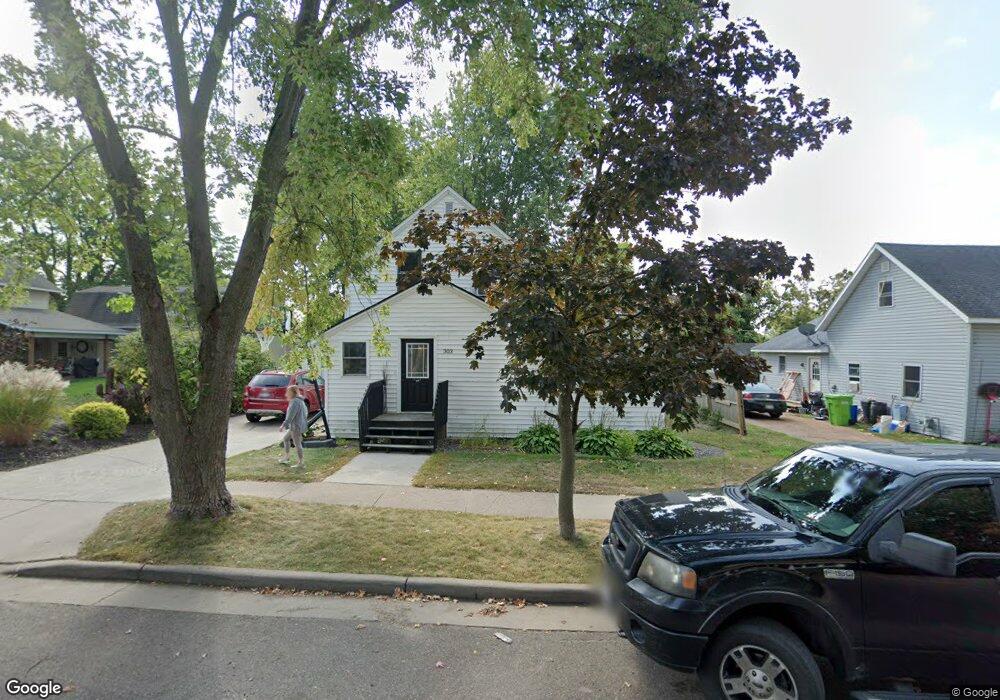
This home is located at 303 W Main St, Thorp, WI 54771 and is currently estimated at $169,631. 303 W Main St is a home located in Clark County with nearby schools including Thorp Elementary School, Thorp High School, and Abundant Life Christian Academy.
Ownership History
Date
Name
Owned For
Owner Type
Purchase Details
Closed on
Sep 3, 2021
Sold by
Moon Dale C
Bought by
Enkers Rodney E
Current Estimated Value
Home Financials for this Owner
Home Financials are based on the most recent Mortgage that was taken out on this home.
Original Mortgage
$64,000
Outstanding Balance
$58,341
Interest Rate
3.62%
Mortgage Type
New Conventional
Estimated Equity
$111,290
Purchase Details
Closed on
Sep 30, 2010
Sold by
Evolution Llc
Bought by
Moon Dale C
Purchase Details
Closed on
Jun 12, 2009
Sold by
The Secretary Of Housing And Urban Devel
Bought by
Evolution Llc
Home Financials for this Owner
Home Financials are based on the most recent Mortgage that was taken out on this home.
Original Mortgage
$59,260
Interest Rate
4.92%
Mortgage Type
Purchase Money Mortgage
Purchase Details
Closed on
Mar 5, 2008
Sold by
Wells Fargo Bank Na
Bought by
The Secretary Of Housing And Urban Devel
Purchase Details
Closed on
Jan 3, 2008
Sold by
Clark County Sheriff
Bought by
Wells Fargo Bank Na
Create a Home Valuation Report for This Property
The Home Valuation Report is an in-depth analysis detailing your home's value as well as a comparison with similar homes in the area
Purchase History
| Date | Buyer | Sale Price | Title Company |
|---|---|---|---|
| Enkers Rodney E | $80,000 | None Available | |
| Moon Dale C | $91,900 | -- | |
| Evolution Llc | -- | -- | |
| The Secretary Of Housing And Urban Devel | -- | -- | |
| Wells Fargo Bank Na | -- | -- |
Source: Public Records
Mortgage History
| Date | Status | Borrower | Loan Amount |
|---|---|---|---|
| Open | Enkers Rodney E | $64,000 | |
| Previous Owner | Evolution Llc | $59,260 |
Source: Public Records
Tax History
| Year | Tax Paid | Tax Assessment Tax Assessment Total Assessment is a certain percentage of the fair market value that is determined by local assessors to be the total taxable value of land and additions on the property. | Land | Improvement |
|---|---|---|---|---|
| 2025 | $2,330 | $138,900 | $7,500 | $131,400 |
| 2024 | $2,382 | $138,900 | $7,500 | $131,400 |
| 2023 | $2,171 | $138,900 | $7,500 | $131,400 |
| 2022 | $2,093 | $80,400 | $3,900 | $76,500 |
| 2021 | $1,869 | $80,400 | $3,900 | $76,500 |
| 2020 | $1,927 | $80,400 | $3,900 | $76,500 |
| 2019 | $1,850 | $80,400 | $3,900 | $76,500 |
| 2018 | $1,787 | $80,400 | $3,900 | $76,500 |
| 2017 | $95 | $80,400 | $3,900 | $76,500 |
| 2016 | $1,680 | $80,400 | $3,900 | $76,500 |
| 2015 | -- | $80,400 | $3,900 | $76,500 |
| 2014 | -- | $80,400 | $3,900 | $76,500 |
| 2013 | -- | $80,400 | $3,900 | $76,500 |
| 2011 | -- | $80,400 | $3,900 | $76,500 |
Source: Public Records
Map
Nearby Homes
- 301 N Church St
- Lot 3 W Prospect St
- 700 N Washington St
- 301 S Washington St
- Lot 2 W Prospect St
- 27 N Wilson St
- Lot 1 W Prospect St
- Lot 28 N Wilson St
- Lot 29 N Wilson St
- Lot 36 N Wilson St
- 413 E Stanley St
- Lot 32 S Church St
- Lot 24 W Hill St
- Lot 23 W Hill St
- Lot 30 W Hill St
- Lot 25 W Hill St
- Lot 35 W Maple St
- 417 Mckenzie St
- 957 Emery St
- N423 9th Ave
Your Personal Tour Guide
Ask me questions while you tour the home.