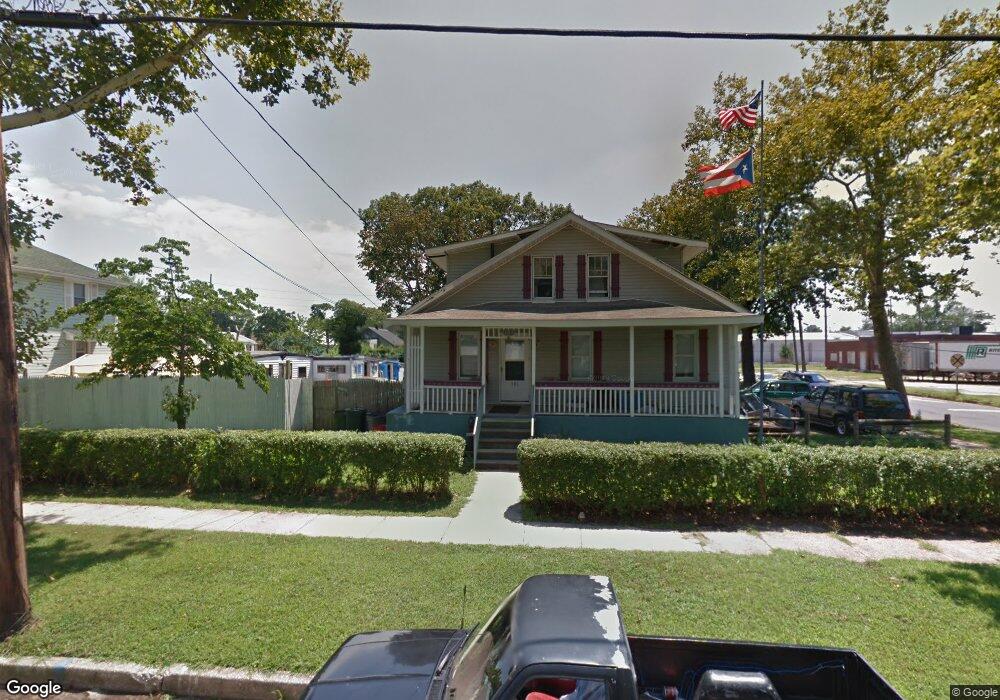
303 W Peach St Vineland, NJ 08360
Estimated Value: $203,084 - $293,000
--
Bed
--
Bath
1,585
Sq Ft
$154/Sq Ft
Est. Value
About This Home
This home is located at 303 W Peach St, Vineland, NJ 08360 and is currently estimated at $244,021, approximately $153 per square foot. 303 W Peach St is a home located in Cumberland County with nearby schools including Max Leuchter Elementary School, Landis Middle School, and Vineland Senior High School.
Ownership History
Date
Name
Owned For
Owner Type
Purchase Details
Closed on
Sep 27, 2017
Sold by
Avila David
Bought by
Avila Damaris and Nunez Jessica Marie
Current Estimated Value
Purchase Details
Closed on
Nov 24, 2006
Sold by
Avila Sergio and Avila Sergio
Bought by
Avila David
Purchase Details
Closed on
Apr 7, 2004
Sold by
Avila Miguel
Bought by
Avila Jose and Avila David
Purchase Details
Closed on
Feb 24, 1998
Sold by
Chase Manhattan Bank
Bought by
Avila Miguel
Purchase Details
Closed on
Jul 12, 1996
Sold by
Forcinito James A
Bought by
Chemical Bank and Cityscape Home Equity Loan Trust 1995 1
Home Financials for this Owner
Home Financials are based on the most recent Mortgage that was taken out on this home.
Original Mortgage
$49,149
Interest Rate
8.27%
Purchase Details
Closed on
Sep 8, 1994
Sold by
Richardson Jacqueline and Cheeseborough Felix
Bought by
Richardson Jacqueline
Create a Home Valuation Report for This Property
The Home Valuation Report is an in-depth analysis detailing your home's value as well as a comparison with similar homes in the area
Home Values in the Area
Average Home Value in this Area
Purchase History
| Date | Buyer | Sale Price | Title Company |
|---|---|---|---|
| Avila Damaris | $1,000 | None Available | |
| Avila David | -- | -- | |
| Avila Jose | -- | -- | |
| Avila Miguel | $38,000 | -- | |
| Chemical Bank | -- | -- | |
| Richardson Jacqueline | -- | -- |
Source: Public Records
Mortgage History
| Date | Status | Borrower | Loan Amount |
|---|---|---|---|
| Previous Owner | Chemical Bank | $49,149 |
Source: Public Records
Tax History Compared to Growth
Tax History
| Year | Tax Paid | Tax Assessment Tax Assessment Total Assessment is a certain percentage of the fair market value that is determined by local assessors to be the total taxable value of land and additions on the property. | Land | Improvement |
|---|---|---|---|---|
| 2025 | $3,365 | $105,700 | $18,400 | $87,300 |
| 2024 | $3,365 | $105,700 | $18,400 | $87,300 |
| 2023 | $3,343 | $105,700 | $18,400 | $87,300 |
| 2022 | $3,244 | $105,700 | $18,400 | $87,300 |
| 2021 | $3,185 | $105,700 | $18,400 | $87,300 |
| 2020 | $3,094 | $105,700 | $18,400 | $87,300 |
| 2019 | $3,052 | $105,700 | $18,400 | $87,300 |
| 2018 | $2,971 | $105,700 | $18,400 | $87,300 |
| 2017 | $2,822 | $105,700 | $18,400 | $87,300 |
| 2016 | $2,723 | $105,700 | $18,400 | $87,300 |
| 2015 | $2,372 | $105,700 | $18,400 | $87,300 |
| 2014 | $2,230 | $105,700 | $18,400 | $87,300 |
Source: Public Records
Map
Nearby Homes
- 330 W Peach St
- 108 W Park Ave
- 329 W Grape St
- 218 W Montrose St
- 404 Montrose St
- 636 E Pear St
- 400 N 7th St
- 511 E Grape St
- 550 Northwest Ave
- 406 S 6th St
- 818 E Pear St
- 724 E Grape St
- 708 E Montrose St Unit 710
- 409 N East Ave
- 411 N East Ave
- 739 E Montrose St
- 818 E Grape St
- 0 W Landis Ave
- 48 N Myrtle St
- 720 E Quince St