Estimated Value: $319,000 - $375,000
3
Beds
3
Baths
2,728
Sq Ft
$131/Sq Ft
Est. Value
About This Home
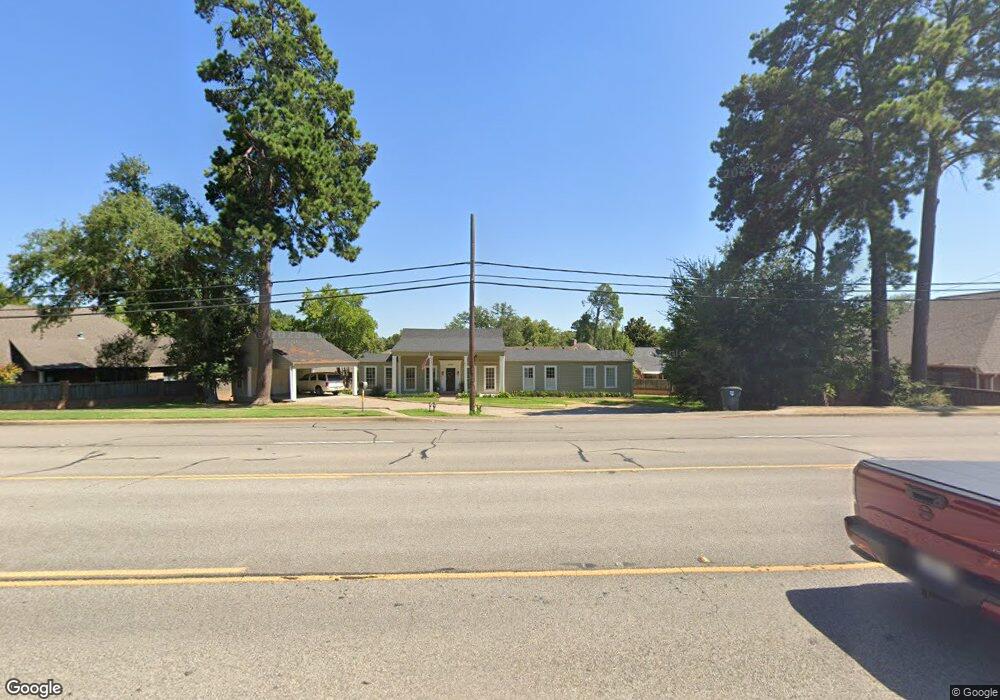
This home is located at 3030 3030 Old Jacksonville, Tyler, TX 75701 and is currently estimated at $356,920, approximately $130 per square foot. 3030 3030 Old Jacksonville is a home located in Smith County with nearby schools including Woods Elementary School, Hubbard Middle School, and Tyler Legacy High School.
Ownership History
Date
Name
Owned For
Owner Type
Purchase Details
Closed on
Sep 30, 2014
Sold by
Tyler Wholesale Housing Llc
Bought by
Rodgers James and Rodgers Brenda
Current Estimated Value
Home Financials for this Owner
Home Financials are based on the most recent Mortgage that was taken out on this home.
Original Mortgage
$134,800
Outstanding Balance
$105,150
Interest Rate
4.74%
Mortgage Type
Adjustable Rate Mortgage/ARM
Estimated Equity
$251,770
Purchase Details
Closed on
Jun 24, 2010
Sold by
Wing Michael James and Wing Pamela Constantz
Bought by
Tyler Wholesale Housing Llc and Jsbs Holdings Llc
Purchase Details
Closed on
Jun 14, 2010
Sold by
Jsbs Holdings Llc
Bought by
Tyler Wholesale Housing Llc
Purchase Details
Closed on
Jul 28, 2005
Sold by
Tarantino Steven Daniel and Mason Leon Eugene
Bought by
Wing Michael and Wing Pamela
Create a Home Valuation Report for This Property
The Home Valuation Report is an in-depth analysis detailing your home's value as well as a comparison with similar homes in the area
Home Values in the Area
Average Home Value in this Area
Purchase History
| Date | Buyer | Sale Price | Title Company |
|---|---|---|---|
| Rodgers James | -- | None Available | |
| Tyler Wholesale Housing Llc | $22,000 | None Available | |
| Tyler Wholesale Housing Llc | $22,000 | None Available | |
| Tyler Wholesale Housing Llc | -- | None Available | |
| Wing Michael | -- | None Available |
Source: Public Records
Mortgage History
| Date | Status | Borrower | Loan Amount |
|---|---|---|---|
| Open | Rodgers James | $134,800 |
Source: Public Records
Tax History Compared to Growth
Tax History
| Year | Tax Paid | Tax Assessment Tax Assessment Total Assessment is a certain percentage of the fair market value that is determined by local assessors to be the total taxable value of land and additions on the property. | Land | Improvement |
|---|---|---|---|---|
| 2025 | -- | $431,357 | $145,019 | $286,338 |
| 2024 | -- | $239,361 | $90,000 | $309,637 |
| 2023 | $3,793 | $391,205 | $90,000 | $301,205 |
| 2022 | $3,876 | $285,904 | $60,000 | $225,904 |
| 2021 | $3,773 | $179,835 | $60,000 | $119,835 |
| 2020 | $3,848 | $179,835 | $60,000 | $119,835 |
| 2019 | $3,731 | $170,639 | $60,000 | $110,639 |
| 2018 | $3,671 | $168,792 | $60,000 | $108,792 |
| 2017 | $3,772 | $176,678 | $60,000 | $116,678 |
| 2016 | $3,698 | $173,231 | $60,000 | $113,231 |
| 2015 | $4,602 | $168,509 | $60,000 | $108,509 |
| 2014 | $4,602 | $216,551 | $60,000 | $156,551 |
Source: Public Records
Map
Nearby Homes
- 1111 Beechwood Dr
- 789 Fairmont Dr
- 640 Beechwood Dr
- 3048 Concord Place
- 3045 Concord Place
- 3324 Teakwood Dr
- 0 Us Highway 271
- 3404 Silverwood Dr
- 509 Buckingham Place
- 2900 S Robertson Ave
- 505 Buckingham Place
- 2917 Sunnybrook Dr
- 3500 Silverwood Dr
- 3501 Silverwood Dr
- 3413 Iberville Dr
- 3425 Iberville Dr
- 2922 W Azalea Dr
- 403 Beechwood Dr
- 3505 Cloverdale Dr
- 3426 Bienville Dr
- 3030 Old Jacksonville Rd
- 723 723 Fairmont
- 745 745 Fairmont Dr
- 723 Fairmont Dr
- 745 Fairmont Dr
- 767 Fairmont Dr
- 3025 Stanford Ct
- 3037 Stanford Ct
- 3001 Stanford Ct
- 796 Fairmont Dr
- 3110 W Jackson St
- 724 Fairmont Dr
- 736 Fairmont Dr
- 712 Fairmont Dr
- 736 736 Fairmont
- 3038 Stanford Ct
- 3026 Stanford Ct
- 748 Fairmont Dr
- 748 748 Fairmont
- 3014 Stanford Ct