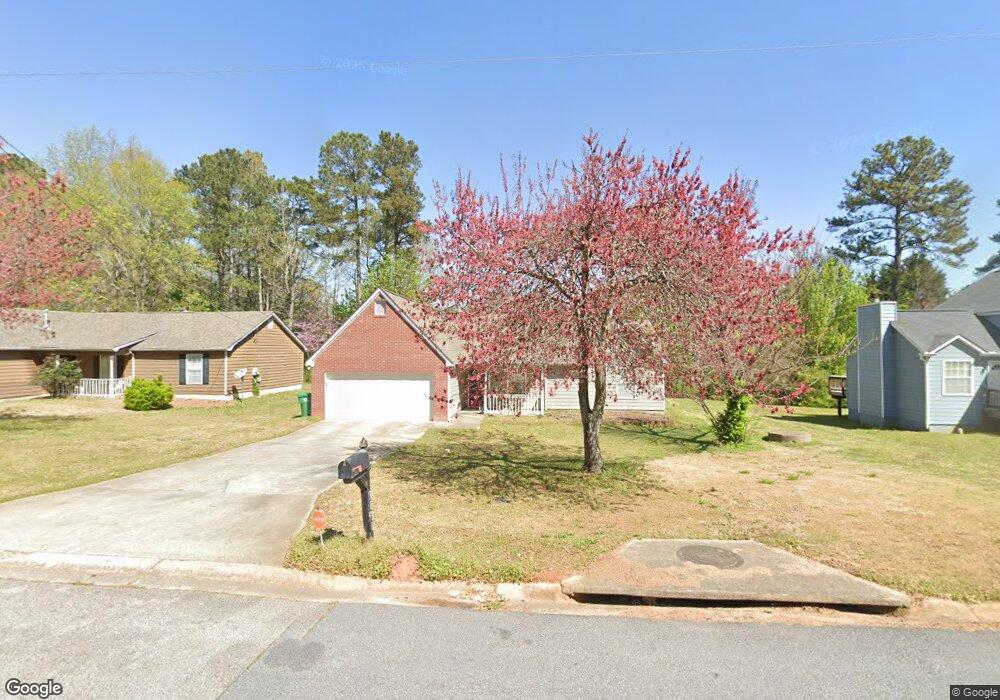
3030 Botany Dr Jonesboro, GA 30236
Estimated Value: $223,000 - $261,000
3
Beds
2
Baths
1,368
Sq Ft
$176/Sq Ft
Est. Value
About This Home
This home is located at 3030 Botany Dr, Jonesboro, GA 30236 and is currently estimated at $240,400, approximately $175 per square foot. 3030 Botany Dr is a home located in Clayton County with nearby schools including Mt. Zion Primary School, Mount Zion Elementary School, and Rex Mill Middle School.
Ownership History
Date
Name
Owned For
Owner Type
Purchase Details
Closed on
May 28, 2020
Sold by
Naylor Tamika N
Bought by
Wright Jonathan D
Current Estimated Value
Home Financials for this Owner
Home Financials are based on the most recent Mortgage that was taken out on this home.
Original Mortgage
$137,871
Outstanding Balance
$122,212
Interest Rate
3.2%
Mortgage Type
FHA
Estimated Equity
$118,188
Purchase Details
Closed on
Mar 12, 2014
Sold by
Grooms Tamika N
Bought by
Naylor Tamika N and Naylor Antwan
Purchase Details
Closed on
Jun 27, 2001
Sold by
Mcleod Alma G
Bought by
Grooms Tamika N
Home Financials for this Owner
Home Financials are based on the most recent Mortgage that was taken out on this home.
Original Mortgage
$106,160
Interest Rate
7.16%
Mortgage Type
FHA
Purchase Details
Closed on
Sep 28, 1994
Sold by
Archit G T
Bought by
Mcleod Alma G
Home Financials for this Owner
Home Financials are based on the most recent Mortgage that was taken out on this home.
Original Mortgage
$81,600
Interest Rate
5.37%
Create a Home Valuation Report for This Property
The Home Valuation Report is an in-depth analysis detailing your home's value as well as a comparison with similar homes in the area
Home Values in the Area
Average Home Value in this Area
Purchase History
| Date | Buyer | Sale Price | Title Company |
|---|---|---|---|
| Wright Jonathan D | $142,000 | -- | |
| Naylor Tamika N | -- | -- | |
| Grooms Tamika N | $107,000 | -- | |
| Mcleod Alma G | $85,900 | -- |
Source: Public Records
Mortgage History
| Date | Status | Borrower | Loan Amount |
|---|---|---|---|
| Open | Wright Jonathan D | $137,871 | |
| Previous Owner | Grooms Tamika N | $106,160 | |
| Previous Owner | Mcleod Alma G | $81,600 |
Source: Public Records
Tax History Compared to Growth
Tax History
| Year | Tax Paid | Tax Assessment Tax Assessment Total Assessment is a certain percentage of the fair market value that is determined by local assessors to be the total taxable value of land and additions on the property. | Land | Improvement |
|---|---|---|---|---|
| 2024 | $3,186 | $90,760 | $8,000 | $82,760 |
| 2023 | $2,871 | $93,560 | $8,000 | $85,560 |
| 2022 | $3,197 | $80,560 | $8,000 | $72,560 |
| 2021 | $2,278 | $56,800 | $7,720 | $49,080 |
| 2020 | $1,983 | $48,698 | $8,000 | $40,698 |
| 2019 | $1,893 | $45,776 | $6,400 | $39,376 |
| 2018 | $1,618 | $39,001 | $6,400 | $32,601 |
| 2017 | $1,325 | $31,708 | $6,400 | $25,308 |
| 2016 | $1,205 | $28,742 | $6,400 | $22,342 |
| 2015 | $1,136 | $0 | $0 | $0 |
| 2014 | $1,036 | $25,164 | $7,200 | $17,964 |
Source: Public Records
Map
Nearby Homes
- 2973 Botany Dr
- 2959 Drexel Ln
- 7161 Laurel Creek Dr
- 3087 Drexel Ln
- 7074 Babbling Brook Dr
- 7101 Hazelwood Dr Unit 8
- 3193 Medina Dr
- 3140 Glen Hollow Dr
- 3145 Deerfield Way
- 3189 Glen Hollow Dr
- 6968 Fielder Rd
- 2877 Kensington Way
- 6921 Babbling Brook Dr
- 3353 Medina Dr
- 7436 Fielder Rd
- 3168 Rock Creek Dr
- 3085 Ashbury Ln Unit 8
- 6844 Silver Maple Dr
- 6848 Silver Maple Dr
- 3022 Botany Dr
- 3022 Botany Dr Unit 7
- 3038 Botany Dr Unit 7
- 3014 Botany Dr
- 3046 Botany Dr
- 3046 Botany Dr Unit 1
- 3025 Medina Dr Unit 5
- 3017 Medina Dr
- 3033 Medina Dr
- 3029 Botany Dr Unit 7
- 3009 Medina Dr
- 3021 Botany Dr
- 3006 Botany Dr Unit 7
- 3041 Medina Dr Unit 5
- 3054 Botany Dr
- 3045 Botany Dr
- 3013 Botany Dr Unit 7
- 3003 Medina Dr
- 3049 Medina Dr Unit 5
- 2998 Botany Dr