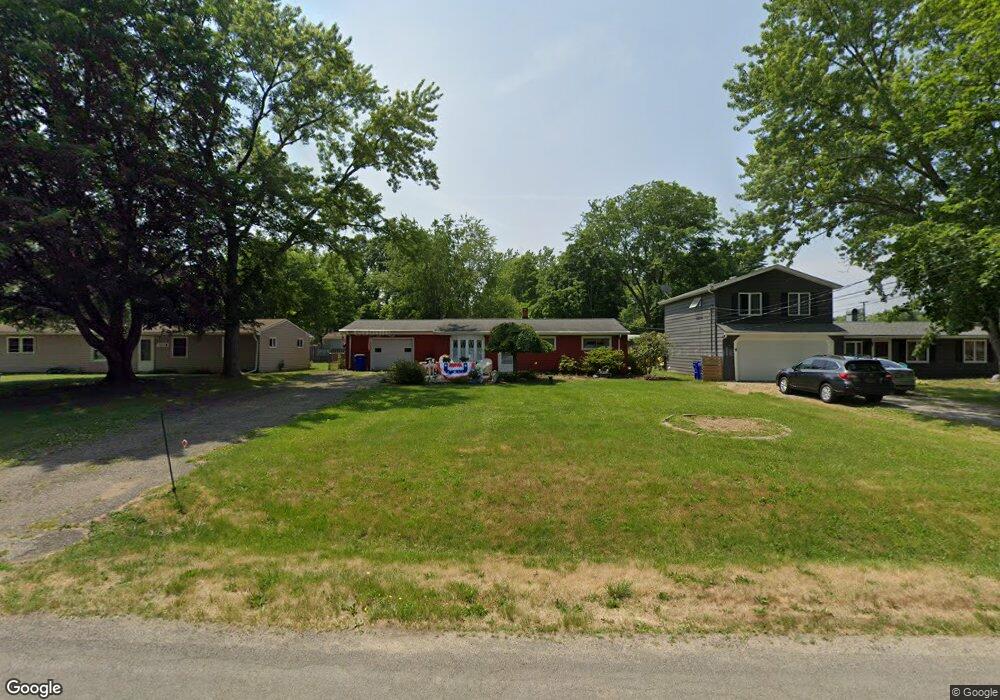
3030 Denny Rd Ravenna, OH 44266
Estimated Value: $146,377 - $176,000
3
Beds
1
Bath
1,088
Sq Ft
$153/Sq Ft
Est. Value
About This Home
This home is located at 3030 Denny Rd, Ravenna, OH 44266 and is currently estimated at $166,094, approximately $152 per square foot. 3030 Denny Rd is a home located in Portage County with nearby schools including Crestwood Primary School, Crestwood Intermediate School, and Crestwood Middle School.
Ownership History
Date
Name
Owned For
Owner Type
Purchase Details
Closed on
Feb 10, 2006
Sold by
Fogleman Ralph E and Fogleman Martha A
Bought by
Fogleman Ralph E and Fogleman Martha A
Current Estimated Value
Purchase Details
Closed on
Jan 1, 1990
Bought by
Fogleman Ralph E
Create a Home Valuation Report for This Property
The Home Valuation Report is an in-depth analysis detailing your home's value as well as a comparison with similar homes in the area
Home Values in the Area
Average Home Value in this Area
Purchase History
| Date | Buyer | Sale Price | Title Company |
|---|---|---|---|
| Fogleman Ralph E | -- | None Available | |
| Fogleman Ralph E | -- | -- |
Source: Public Records
Tax History Compared to Growth
Tax History
| Year | Tax Paid | Tax Assessment Tax Assessment Total Assessment is a certain percentage of the fair market value that is determined by local assessors to be the total taxable value of land and additions on the property. | Land | Improvement |
|---|---|---|---|---|
| 2024 | $1,366 | $43,200 | $8,930 | $34,270 |
| 2023 | $1,241 | $36,860 | $8,930 | $27,930 |
| 2022 | $1,271 | $36,860 | $8,930 | $27,930 |
| 2021 | $1,262 | $36,860 | $8,930 | $27,930 |
| 2020 | $942 | $28,320 | $8,930 | $19,390 |
| 2019 | $924 | $28,320 | $8,930 | $19,390 |
| 2018 | $1,059 | $27,060 | $9,840 | $17,220 |
| 2017 | $888 | $27,060 | $9,840 | $17,220 |
| 2016 | $1,271 | $27,060 | $9,840 | $17,220 |
| 2015 | $1,023 | $27,060 | $9,840 | $17,220 |
| 2014 | $1,010 | $27,060 | $9,840 | $17,220 |
| 2013 | $1,026 | $27,060 | $9,840 | $17,220 |
Source: Public Records
Map
Nearby Homes
- 3065 Polly Rd
- 3161 Denny Rd
- 2972 Douglas St
- 3599 Beck Rd
- 2926 Frost Rd
- 2784 Frost Rd
- 8856 Coit Rd
- 2773 Frost Rd
- 9329 Infirmary Rd Unit B1
- 2785 Fairfax St
- 10306 Winthrop Rd
- 2653 Fairfax St
- 2661 Notle St
- 2639 Clermont St
- 9244 Lakeside Dr
- V/L Bartlett Rd
- V/L State Route 14
- 10115 Infirmary Rd
- 1725 Pike Pkwy
- 4196 Webb Rd