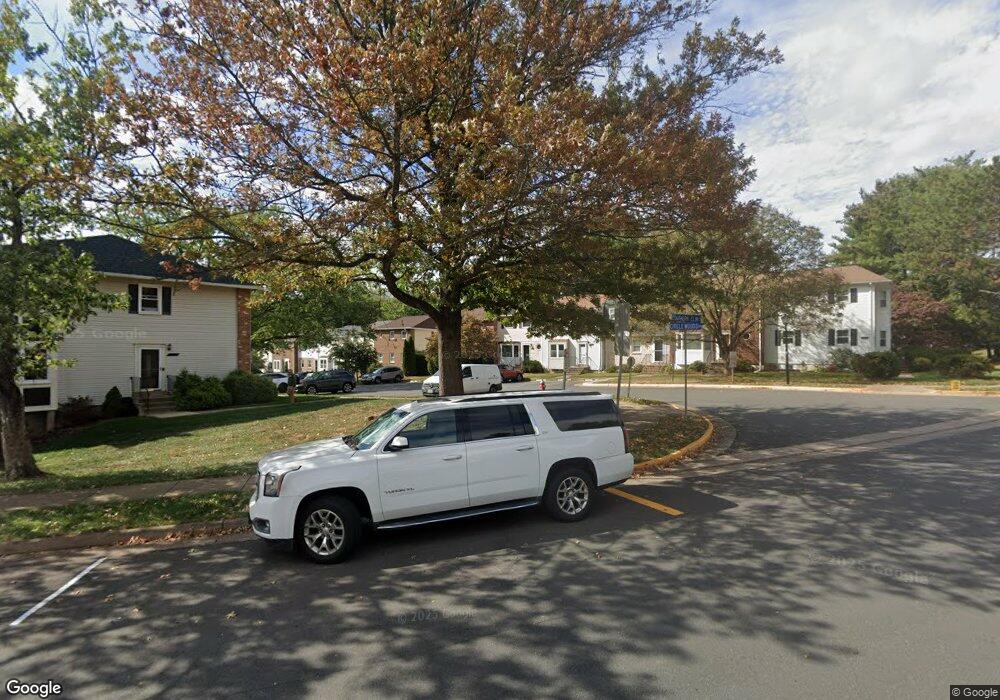
3030 Southern Elm Ct Fairfax, VA 22031
Estimated Value: $708,000 - $729,000
3
Beds
4
Baths
2,310
Sq Ft
$312/Sq Ft
Est. Value
About This Home
This home is located at 3030 Southern Elm Ct, Fairfax, VA 22031 and is currently estimated at $721,741, approximately $312 per square foot. 3030 Southern Elm Ct is a home located in Fairfax County with nearby schools including Mosby Woods Elementary School, Thoreau Middle School, and Appletree School.
Ownership History
Date
Name
Owned For
Owner Type
Purchase Details
Closed on
Oct 18, 2021
Sold by
Djoubrailov Konstantin Totev and Djoubrailov Petya Georgieva
Bought by
Djoubrailov Konstantin Totev and Djoubrailov Konstantin Totev
Current Estimated Value
Purchase Details
Closed on
Aug 19, 2011
Sold by
Purcell Christopher E
Bought by
Djoubrailov Konstantin and Keremedchieva Petya
Home Financials for this Owner
Home Financials are based on the most recent Mortgage that was taken out on this home.
Original Mortgage
$350,100
Outstanding Balance
$242,969
Interest Rate
4.62%
Mortgage Type
New Conventional
Estimated Equity
$478,772
Purchase Details
Closed on
Jun 23, 1995
Sold by
Yu Yueh E
Bought by
Purcell Christopher E
Home Financials for this Owner
Home Financials are based on the most recent Mortgage that was taken out on this home.
Original Mortgage
$155,750
Interest Rate
7.82%
Create a Home Valuation Report for This Property
The Home Valuation Report is an in-depth analysis detailing your home's value as well as a comparison with similar homes in the area
Home Values in the Area
Average Home Value in this Area
Purchase History
| Date | Buyer | Sale Price | Title Company |
|---|---|---|---|
| Djoubrailov Konstantin Totev | -- | None Available | |
| Djoubrailov Konstantin | $389,000 | -- | |
| Purcell Christopher E | $159,000 | -- |
Source: Public Records
Mortgage History
| Date | Status | Borrower | Loan Amount |
|---|---|---|---|
| Open | Djoubrailov Konstantin | $350,100 | |
| Previous Owner | Purcell Christopher E | $155,750 |
Source: Public Records
Tax History Compared to Growth
Tax History
| Year | Tax Paid | Tax Assessment Tax Assessment Total Assessment is a certain percentage of the fair market value that is determined by local assessors to be the total taxable value of land and additions on the property. | Land | Improvement |
|---|---|---|---|---|
| 2025 | $7,158 | $661,300 | $195,000 | $466,300 |
| 2024 | $7,158 | $617,910 | $185,000 | $432,910 |
| 2023 | $6,630 | $587,510 | $175,000 | $412,510 |
| 2022 | $6,718 | $587,510 | $175,000 | $412,510 |
| 2021 | $6,212 | $529,320 | $155,000 | $374,320 |
| 2020 | $5,894 | $498,030 | $150,000 | $348,030 |
| 2019 | $5,662 | $478,450 | $140,000 | $338,450 |
| 2018 | $5,236 | $455,290 | $135,000 | $320,290 |
| 2017 | $5,286 | $455,290 | $135,000 | $320,290 |
| 2016 | $5,217 | $450,290 | $130,000 | $320,290 |
| 2015 | $5,025 | $450,290 | $130,000 | $320,290 |
| 2014 | $4,684 | $420,650 | $120,000 | $300,650 |
Source: Public Records
Map
Nearby Homes
- 3065 White Birch Ct
- 3033 White Birch Ct
- 3054 Mission Square Dr
- 3003 Mission Square Dr
- 9652 Pullman Place
- 9606 Blake Ln
- 0 Blake Ln Blake Ln Service Rd Unit VAFX2167468
- 9523 Bastille St Unit 207
- 3146 Cantrell Ln
- 2907 Bleeker St Unit 3-106
- 2960 Vaden Dr Unit 2-406
- 2960 Vaden Dr Unit 2-307
- 2960 Vaden Dr Unit 2-312
- 2960 Vaden Dr Unit 413
- 9473 Fairfax Blvd Unit 104
- 9555 Saintsbury Dr Unit 503
- 9491 Fairfax Blvd Unit 303
- 2903 Saintsbury Plaza Unit 310
- 2903 Saintsbury Plaza Unit 405
- 2905 Saintsbury Plaza Unit 312
- 3028 Southern Elm Ct
- 3032 Southern Elm Ct
- 3026 Southern Elm Ct
- 3034 Southern Elm Ct
- 3024 Southern Elm Ct
- 3036 Southern Elm Ct
- 3022 Southern Elm Ct
- 3086 Winter Pine Ct
- 3038 Southern Elm Ct
- 3084 Winter Pine Ct
- 3088 Winter Pine Ct
- 3082 Winter Pine Ct
- 3020 Southern Elm Ct
- 3090 Winter Pine Ct
- 3040 Southern Elm Ct
- 3080 Winter Pine Ct
- 3092 Winter Pine Ct
- 3033 Southern Elm Ct
- 3035 Southern Elm Ct
- 3078 Winter Pine Ct