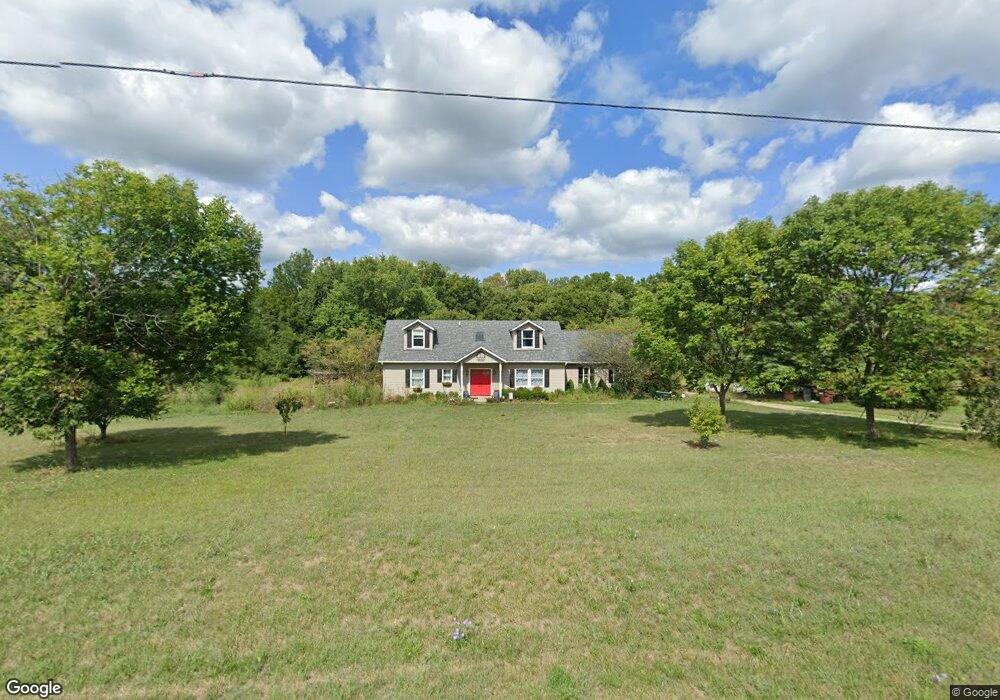
30301 Orr Rd Circleville, OH 43113
Estimated Value: $373,000 - $508,000
4
Beds
2
Baths
2,475
Sq Ft
$181/Sq Ft
Est. Value
About This Home
This home is located at 30301 Orr Rd, Circleville, OH 43113 and is currently estimated at $448,530, approximately $181 per square foot. 30301 Orr Rd is a home located in Pickaway County with nearby schools including Logan Elm High School.
Ownership History
Date
Name
Owned For
Owner Type
Purchase Details
Closed on
Nov 14, 2011
Sold by
Jeffers Harlan W
Bought by
Bates Kip A
Current Estimated Value
Home Financials for this Owner
Home Financials are based on the most recent Mortgage that was taken out on this home.
Original Mortgage
$199,803
Outstanding Balance
$135,256
Interest Rate
3.87%
Mortgage Type
FHA
Estimated Equity
$313,274
Purchase Details
Closed on
Oct 13, 2011
Sold by
Chambers Richard F and Chambers Barbara R
Bought by
Shilling Richard M and Shilling Janine W
Home Financials for this Owner
Home Financials are based on the most recent Mortgage that was taken out on this home.
Original Mortgage
$199,803
Outstanding Balance
$135,256
Interest Rate
3.87%
Mortgage Type
FHA
Estimated Equity
$313,274
Purchase Details
Closed on
Jan 23, 2004
Sold by
Riley Dorothy S
Bought by
Riley David S and Riley Steve
Purchase Details
Closed on
Jun 1, 1988
Create a Home Valuation Report for This Property
The Home Valuation Report is an in-depth analysis detailing your home's value as well as a comparison with similar homes in the area
Home Values in the Area
Average Home Value in this Area
Purchase History
| Date | Buyer | Sale Price | Title Company |
|---|---|---|---|
| Bates Kip A | $205,000 | Transcounty Title | |
| Shilling Richard M | $212,500 | Title First Agency Inc | |
| Riley David S | -- | None Available | |
| -- | $606,100 | -- |
Source: Public Records
Mortgage History
| Date | Status | Borrower | Loan Amount |
|---|---|---|---|
| Open | Bates Kip A | $199,803 | |
| Closed | Shilling Richard M | $170,000 |
Source: Public Records
Tax History Compared to Growth
Tax History
| Year | Tax Paid | Tax Assessment Tax Assessment Total Assessment is a certain percentage of the fair market value that is determined by local assessors to be the total taxable value of land and additions on the property. | Land | Improvement |
|---|---|---|---|---|
| 2024 | -- | $123,300 | $27,110 | $96,190 |
| 2023 | $4,058 | $123,300 | $27,110 | $96,190 |
| 2022 | $3,079 | $87,560 | $22,470 | $65,090 |
| 2021 | $3,158 | $87,560 | $22,470 | $65,090 |
| 2020 | $3,199 | $87,560 | $22,470 | $65,090 |
| 2019 | $2,507 | $75,650 | $21,040 | $54,610 |
| 2018 | $2,952 | $75,650 | $21,040 | $54,610 |
| 2017 | $4,244 | $75,650 | $21,040 | $54,610 |
| 2016 | $2,212 | $69,860 | $19,250 | $50,610 |
| 2015 | $2,220 | $69,860 | $19,250 | $50,610 |
| 2014 | $2,224 | $69,860 | $19,250 | $50,610 |
| 2013 | $2,399 | $73,380 | $19,250 | $54,130 |
Source: Public Records
Map
Nearby Homes
- 20702 Us Highway 23
- 19 Crystal Dr
- 24 2nd St
- 23 Eastern Ave
- 7183 Kingston Adelphi Rd
- 7178 Ohio 159
- 1667 Stone Rd Unit Lot 59
- 500 Old Elm Rd
- 6386 Zane Trail Rd
- 0 US Rt 23 Unit 1857559
- 6516 Zane Trail Rd
- 25460 Us Highway 23 S
- 527 Jadwin Rd
- 0 Monticello St
- 311 Tarlton Rd
- 331 Tarlton Rd
- 213 Sulphur Spring Rd
- 7875 Dry Run Rd
- 277 Sulphur Spring Rd
- 355 Cherokee Dr