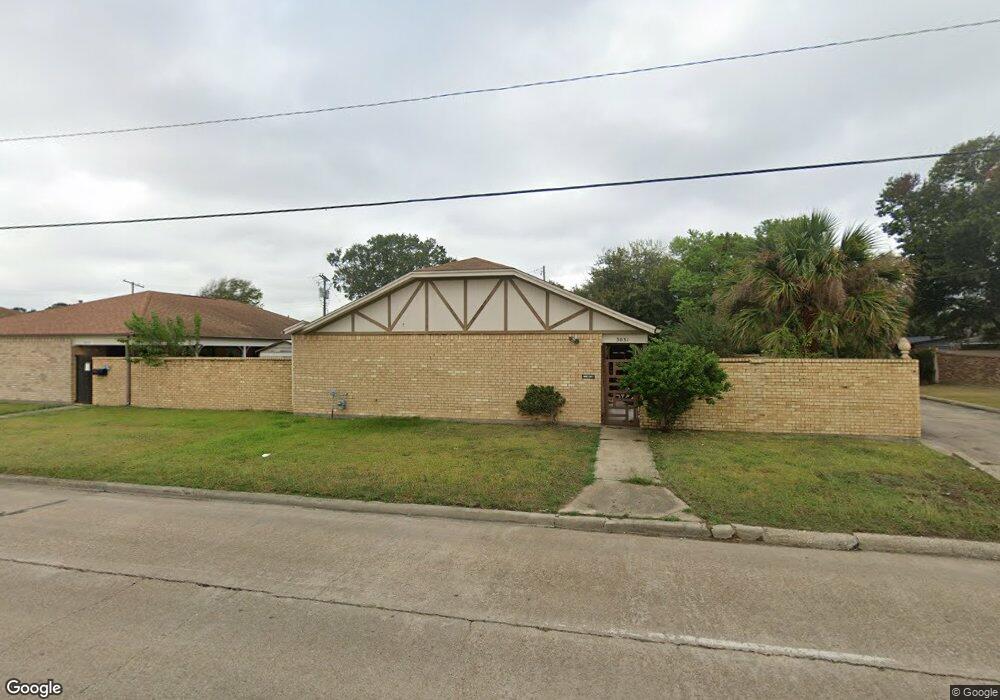
3031 39th St Port Arthur, TX 77642
Estimated Value: $114,474 - $165,000
2
Beds
2
Baths
1,494
Sq Ft
$92/Sq Ft
Est. Value
About This Home
This home is located at 3031 39th St, Port Arthur, TX 77642 and is currently estimated at $136,869, approximately $91 per square foot. 3031 39th St is a home located in Jefferson County with nearby schools including Houston Elementary School, Abraham Lincoln Middle School, and Memorial High School.
Ownership History
Date
Name
Owned For
Owner Type
Purchase Details
Closed on
Dec 2, 2017
Sold by
Brinkmann Mandy
Bought by
Hernandez Genoveva
Current Estimated Value
Purchase Details
Closed on
Mar 15, 2012
Sold by
Brinkmann Mandy Darlene
Bought by
Hernandez Genoveva G
Home Financials for this Owner
Home Financials are based on the most recent Mortgage that was taken out on this home.
Original Mortgage
$52,900
Interest Rate
3.9%
Mortgage Type
Seller Take Back
Purchase Details
Closed on
Jan 13, 2011
Sold by
Brinkmann Mandy and Estate Of Candy Murray
Bought by
Brinkmann Mandy
Purchase Details
Closed on
Sep 30, 2009
Sold by
Duplant Susan Alice and Reagle Wayne Eugene
Bought by
Murray Candy Darlene
Create a Home Valuation Report for This Property
The Home Valuation Report is an in-depth analysis detailing your home's value as well as a comparison with similar homes in the area
Home Values in the Area
Average Home Value in this Area
Purchase History
| Date | Buyer | Sale Price | Title Company |
|---|---|---|---|
| Hernandez Genoveva | -- | None Available | |
| Hernandez Genoveva G | -- | None Available | |
| Brinkmann Mandy | -- | None Available | |
| Murray Candy Darlene | -- | None Available |
Source: Public Records
Mortgage History
| Date | Status | Borrower | Loan Amount |
|---|---|---|---|
| Previous Owner | Hernandez Genoveva G | $52,900 |
Source: Public Records
Tax History Compared to Growth
Tax History
| Year | Tax Paid | Tax Assessment Tax Assessment Total Assessment is a certain percentage of the fair market value that is determined by local assessors to be the total taxable value of land and additions on the property. | Land | Improvement |
|---|---|---|---|---|
| 2025 | $962 | $85,491 | -- | -- |
| 2024 | $962 | $77,719 | -- | -- |
| 2023 | $962 | $70,654 | $0 | $0 |
| 2022 | $2,040 | $64,231 | $0 | $0 |
| 2021 | $1,935 | $86,377 | $3,828 | $82,549 |
| 2020 | $1,179 | $53,084 | $3,828 | $49,256 |
| 2019 | $1,692 | $53,090 | $3,830 | $49,260 |
| 2018 | $1,692 | $53,090 | $3,830 | $49,260 |
| 2017 | $1,811 | $58,440 | $3,830 | $54,610 |
| 2016 | $1,712 | $58,440 | $3,830 | $54,610 |
| 2015 | $1,649 | $55,230 | $3,830 | $51,400 |
| 2014 | $1,649 | $55,230 | $3,830 | $51,400 |
Source: Public Records
Map
Nearby Homes