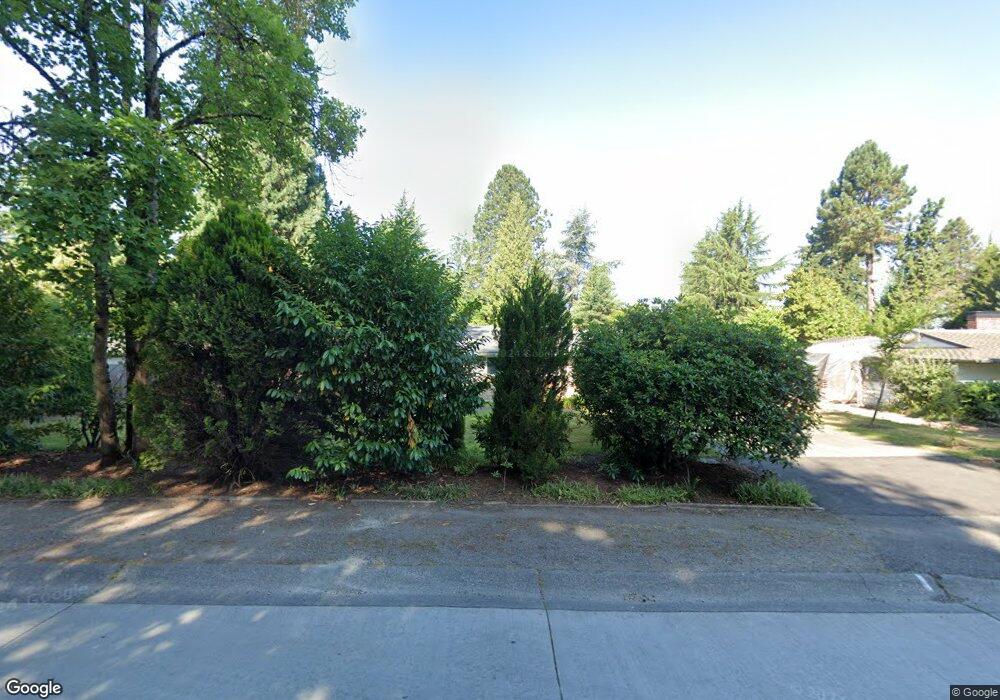
3031 Hunts Pt Rd Hunts Point, WA 98004
Estimated Value: $2,025,000 - $3,195,000
3
Beds
2
Baths
2,070
Sq Ft
$1,373/Sq Ft
Est. Value
About This Home
This home is located at 3031 Hunts Pt Rd, Hunts Point, WA 98004 and is currently estimated at $2,842,676, approximately $1,373 per square foot. 3031 Hunts Pt Rd is a home located in King County with nearby schools including Clyde Hill Elementary School, Chinook Middle School, and Bellevue High School.
Ownership History
Date
Name
Owned For
Owner Type
Purchase Details
Closed on
Sep 11, 2025
Sold by
Shah Living Trust and Shah Lalita Ratilal
Bought by
Shah Lalita Ratilal
Current Estimated Value
Purchase Details
Closed on
Aug 19, 2020
Sold by
Shah Ratilal M and Shah Lalita
Bought by
Shah Ratilal Meghji and Shah Lalita Ratilal
Purchase Details
Closed on
Jun 26, 1997
Sold by
Shah Bijal R
Bought by
Shah Ratilal M and Shah Lalita
Home Financials for this Owner
Home Financials are based on the most recent Mortgage that was taken out on this home.
Original Mortgage
$244,500
Interest Rate
7.92%
Mortgage Type
Seller Take Back
Purchase Details
Closed on
Mar 4, 1997
Sold by
Sands Sinead A
Bought by
Shah Bijal R
Purchase Details
Closed on
Dec 23, 1996
Sold by
Rosche Sylvia
Bought by
Shah Bijal R and Sands Sinead
Home Financials for this Owner
Home Financials are based on the most recent Mortgage that was taken out on this home.
Original Mortgage
$244,500
Interest Rate
6.5%
Purchase Details
Closed on
Feb 11, 1993
Sold by
Fox Katherine S
Bought by
Shah Bijal R and Rosche Sylvia
Create a Home Valuation Report for This Property
The Home Valuation Report is an in-depth analysis detailing your home's value as well as a comparison with similar homes in the area
Home Values in the Area
Average Home Value in this Area
Purchase History
| Date | Buyer | Sale Price | Title Company |
|---|---|---|---|
| Shah Lalita Ratilal | $313 | None Listed On Document | |
| Shah Zakharia Irrevocable Trust | $313 | None Listed On Document | |
| Shah Ratilal Meghji | -- | Mang Law & Title Pa | |
| Shah Ratilal M | $330,000 | Old Republic Title Ltd | |
| Shah Bijal R | -- | Chicago Title Insurance Co | |
| Shah Bijal R | $140,603 | Chicago Title Insurance Co | |
| Shah Bijal R | $258,000 | -- |
Source: Public Records
Mortgage History
| Date | Status | Borrower | Loan Amount |
|---|---|---|---|
| Previous Owner | Shah Ratilal M | $244,500 | |
| Previous Owner | Shah Bijal R | $244,500 |
Source: Public Records
Tax History Compared to Growth
Tax History
| Year | Tax Paid | Tax Assessment Tax Assessment Total Assessment is a certain percentage of the fair market value that is determined by local assessors to be the total taxable value of land and additions on the property. | Land | Improvement |
|---|---|---|---|---|
| 2024 | $16,008 | $2,555,000 | $2,554,000 | $1,000 |
| 2023 | $16,198 | $2,384,000 | $2,383,000 | $1,000 |
| 2022 | $14,572 | $2,658,000 | $2,657,000 | $1,000 |
| 2021 | $13,822 | $2,008,000 | $2,007,000 | $1,000 |
| 2020 | $13,969 | $1,759,000 | $1,758,000 | $1,000 |
| 2018 | $10,143 | $1,418,000 | $1,015,000 | $403,000 |
| 2017 | $8,191 | $1,264,000 | $905,000 | $359,000 |
| 2016 | $7,853 | $1,104,000 | $832,000 | $272,000 |
| 2015 | $7,448 | $1,022,000 | $770,000 | $252,000 |
| 2014 | -- | $965,000 | $728,000 | $237,000 |
| 2013 | -- | $887,000 | $641,000 | $246,000 |
Source: Public Records
Map
Nearby Homes
- 8580 Hunts Point Ln
- 8910 NE 33rd St
- 3215 78th Place NE
- 3108 92nd Ave NE
- 2404 79th Ave NE
- 2837 Evergreen Point Rd
- 3327 Evergreen Point Rd
- 3263 Evergreen Point Rd
- 2305 88th Ave NE
- 2425 Evergreen Point Rd
- 2409 Evergreen Point Rd
- 2627 96th Ave NE
- 8638 NE 19th Place
- 4226 92nd Ave NE
- 9135 NE 19th St
- 1525 79th Place NE
- 4662 95th Ave NE
- 10054 NE 33rd St Unit 2&3
- 4640 95th Ave NE
- 9813 NE 21st St
- 3031 Hunts Point Rd
- 3113 Hunts Point Rd
- 8322 Hunts Point Place
- 3028 Hunts Point Rd
- 3123 Hunts Point Rd
- 8319 Hunts Point Place
- 3019 Hunts Point Rd
- 3022 Hunts Point Rd
- 8314 Hunts Point Place
- 8412 Hunts Point Ln
- 3038 Hunts Point Rd
- 3024 Hunts Point Rd
- 3001 Hunts Point Rd
- 8304 Hunts Point Place
- 3143 Hunts Point Rd
- 3028 Hunts Point Cir
- 3143 Hunts Point Rd
- 8326 Hunts Point Cir
- 3034 Hunts Point Rd