Estimated Value: $246,000 - $267,000
3
Beds
2
Baths
1,710
Sq Ft
$150/Sq Ft
Est. Value
About This Home
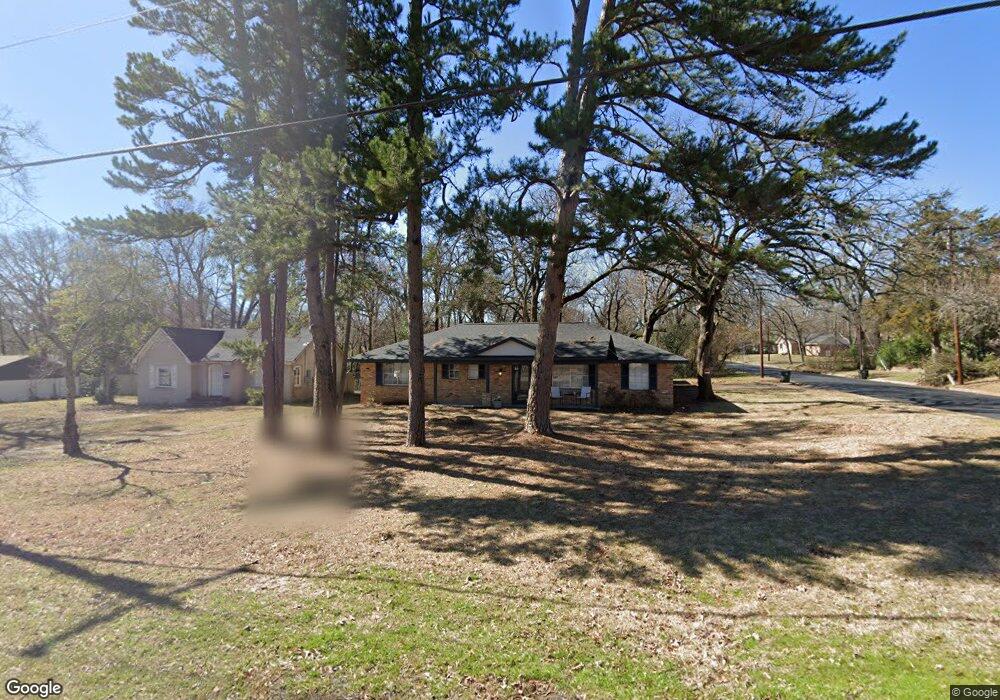
This home is located at 3031 New Copeland Rd, Tyler, TX 75701 and is currently estimated at $255,808, approximately $149 per square foot. 3031 New Copeland Rd is a home located in Smith County with nearby schools including Woods Elementary School, Hubbard Middle School, and Tyler Legacy High School.
Ownership History
Date
Name
Owned For
Owner Type
Purchase Details
Closed on
Feb 25, 2005
Sold by
Galloway Hallie
Bought by
Carns Ross
Current Estimated Value
Home Financials for this Owner
Home Financials are based on the most recent Mortgage that was taken out on this home.
Original Mortgage
$65,000
Outstanding Balance
$32,861
Interest Rate
5.77%
Mortgage Type
Seller Take Back
Estimated Equity
$222,947
Create a Home Valuation Report for This Property
The Home Valuation Report is an in-depth analysis detailing your home's value as well as a comparison with similar homes in the area
Home Values in the Area
Average Home Value in this Area
Purchase History
| Date | Buyer | Sale Price | Title Company |
|---|---|---|---|
| Carns Ross | -- | None Available | |
| Carns Ross | -- | None Available |
Source: Public Records
Mortgage History
| Date | Status | Borrower | Loan Amount |
|---|---|---|---|
| Open | Carns Ross | $65,000 | |
| Closed | Carns Ross | $65,000 |
Source: Public Records
Tax History Compared to Growth
Tax History
| Year | Tax Paid | Tax Assessment Tax Assessment Total Assessment is a certain percentage of the fair market value that is determined by local assessors to be the total taxable value of land and additions on the property. | Land | Improvement |
|---|---|---|---|---|
| 2025 | $4,089 | $274,410 | $74,701 | $199,709 |
| 2024 | $4,089 | $240,379 | $38,221 | $202,158 |
| 2023 | $4,288 | $245,976 | $38,221 | $207,755 |
| 2022 | $3,288 | $167,827 | $27,891 | $139,936 |
| 2021 | $3,036 | $144,685 | $27,891 | $116,794 |
| 2020 | $3,014 | $140,833 | $27,891 | $112,942 |
| 2019 | $2,882 | $131,807 | $20,660 | $111,147 |
| 2018 | $3,011 | $138,453 | $20,660 | $117,793 |
| 2017 | $2,791 | $130,784 | $20,660 | $110,124 |
| 2016 | $2,537 | $118,825 | $20,660 | $98,165 |
| 2015 | $2,142 | $114,845 | $20,660 | $94,185 |
| 2014 | $2,142 | $111,651 | $20,660 | $90,991 |
Source: Public Records
Map
Nearby Homes
- 3202 S Donnybrook Ave
- 3210 S Donnybrook Ave
- 315 Ridgecrest Dr
- 611 E Watkins St
- 121 Fair Ln
- 317 Amberwood Cir
- 905 E Watkins St
- 2835 S Broadway Ave
- 3511 S Keaton Ave
- 1018 Pollard Dr
- 3300 Old Bullard Rd
- 904 E Dulse St
- 2736 Old Bullard Rd
- 1101 Clyde Dr
- 403 Beechwood Dr
- 3308 Greenoak Place
- 3712 Colony Park Dr
- 309 Glenhaven Dr
- 1113 E Amherst Dr
- 3710 Bain Place
- 3031 3031 New Copeland Dr
- 3031 3031 New Copeland Rd
- 3037 New Copeland Rd
- 427 Stanford St
- 512 Stanford St
- 522 Stanford St
- 3101 New Copeland Rd
- 3101 3101 New Copeland Rd
- 3018 Crestview St
- 3018 3018 Crestview
- 419 Stanford St
- 3014 Crestview St
- 3013 New Copeland Rd
- 426 Tech Place
- 3013 3013 New Copeland
- 3014 3014 Crestview
- 3107 New Copeland Rd
- 420 Stanford St
- 3008 Crestview St
- 3009 New Copeland Rd