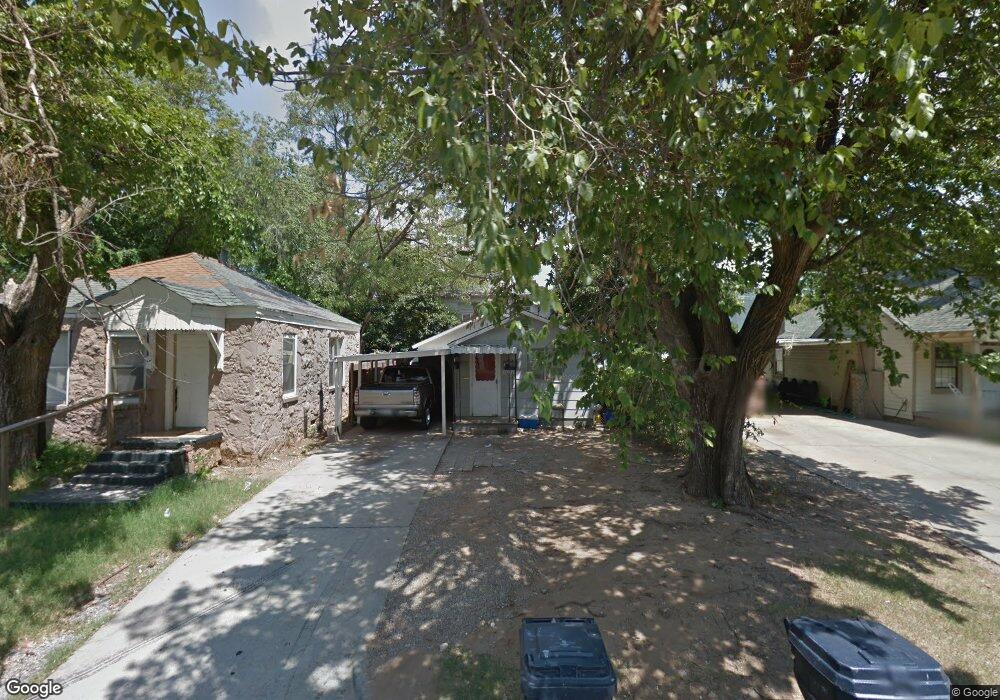
3031 North Place Oklahoma City, OK 73107
Milam Place NeighborhoodEstimated Value: $152,143 - $203,000
2
Beds
1
Bath
1,185
Sq Ft
$147/Sq Ft
Est. Value
About This Home
This home is located at 3031 North Place, Oklahoma City, OK 73107 and is currently estimated at $173,786, approximately $146 per square foot. 3031 North Place is a home located in Oklahoma County with nearby schools including Kaiser Elementary School, Taft Middle School, and Northwest Classen High School.
Ownership History
Date
Name
Owned For
Owner Type
Purchase Details
Closed on
Oct 15, 2024
Sold by
Estrada-Rios Ramiro and Estrada-Rios Tracy
Bought by
Rios Claudio Estrada
Current Estimated Value
Purchase Details
Closed on
Jul 13, 2007
Sold by
Rowland Audrey L and Rowland Royce E
Bought by
Estrada Rios Ramiro and Estrada Rios Tracy
Home Financials for this Owner
Home Financials are based on the most recent Mortgage that was taken out on this home.
Original Mortgage
$51,600
Interest Rate
6.72%
Mortgage Type
Purchase Money Mortgage
Purchase Details
Closed on
Jul 12, 2007
Sold by
Aleshire Allen A and Aleshire Susan L
Bought by
Estrada Rios Ramiro and Estrada Rios Tracy
Home Financials for this Owner
Home Financials are based on the most recent Mortgage that was taken out on this home.
Original Mortgage
$51,600
Interest Rate
6.72%
Mortgage Type
Purchase Money Mortgage
Purchase Details
Closed on
Mar 15, 2002
Sold by
Aleshire Vera A
Bought by
Aleshire Vera A and Rowland Audrey L
Create a Home Valuation Report for This Property
The Home Valuation Report is an in-depth analysis detailing your home's value as well as a comparison with similar homes in the area
Home Values in the Area
Average Home Value in this Area
Purchase History
| Date | Buyer | Sale Price | Title Company |
|---|---|---|---|
| Rios Claudio Estrada | -- | None Listed On Document | |
| Estrada Rios Ramiro | -- | Ward Title & Closing Company | |
| Estrada Rios Ramiro | -- | Ward Title & Closing Company | |
| Aleshire Vera A | -- | -- |
Source: Public Records
Mortgage History
| Date | Status | Borrower | Loan Amount |
|---|---|---|---|
| Previous Owner | Estrada Rios Ramiro | $51,600 | |
| Previous Owner | Estrada Rios Ramiro | $51,600 |
Source: Public Records
Tax History Compared to Growth
Tax History
| Year | Tax Paid | Tax Assessment Tax Assessment Total Assessment is a certain percentage of the fair market value that is determined by local assessors to be the total taxable value of land and additions on the property. | Land | Improvement |
|---|---|---|---|---|
| 2024 | $586 | $5,012 | $340 | $4,672 |
| 2023 | $586 | $4,773 | $372 | $4,401 |
| 2022 | $535 | $4,546 | $362 | $4,184 |
| 2021 | $510 | $4,330 | $410 | $3,920 |
| 2020 | $491 | $4,124 | $272 | $3,852 |
| 2019 | $467 | $3,927 | $276 | $3,651 |
| 2018 | $160 | $1,408 | $0 | $0 |
| 2017 | $160 | $1,408 | $781 | $627 |
| 2016 | $385 | $3,393 | $408 | $2,985 |
| 2015 | $370 | $3,231 | $411 | $2,820 |
| 2014 | $350 | $3,077 | $412 | $2,665 |
Source: Public Records
Map
Nearby Homes
- 3104 NW 21st St
- 2208 N Brookline Ave
- 3105 NW 22nd St
- 3117 NW 23rd St
- 3217 NW 22nd St
- 3232 NW 21st St
- 3216 NW 19th St
- 3013 NW 24th St
- 2822 NW 19th St
- 2841 NW 20th St
- 2854 NW 19th St
- 3157 NW 25th St
- 2809 NW 21st St
- 3132 NW 16th St
- 2939 NW 15th St
- 2765 NW 20th St
- 1521 N Drexel Blvd
- 2934 NW 15th St
- 2748 NW 22nd St
- 3416 NW 20th St
- 3035 North Place
- 3029 North Place
- 3037 North Place
- 3032 NW 21st St
- 3025 North Place
- 3036 NW 21st St
- 3032 North Place
- 2112 N Drexel Blvd
- 3028 North Place
- 3020 NW 21st St
- 3100 NW 21st St
- 3017 North Place
- 3018 NW 21st St
- 3031 NW 20th St
- 2100 N Drexel Blvd
- 3033 NW 20th St
- 3016 North Place
- 3027 NW 20th St
- 3025 NW 20th St