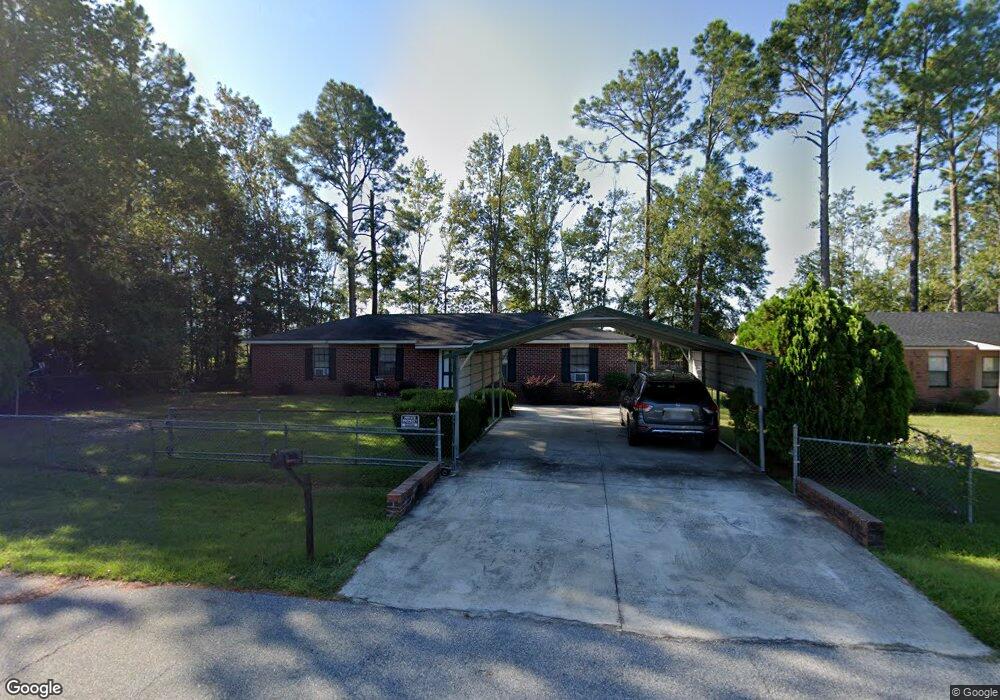
3032 E Park Ct Albany, GA 31705
Estimated Value: $83,000 - $106,000
3
Beds
2
Baths
1,539
Sq Ft
$62/Sq Ft
Est. Value
About This Home
This home is located at 3032 E Park Ct, Albany, GA 31705 and is currently estimated at $96,080, approximately $62 per square foot. 3032 E Park Ct is a home located in Dougherty County with nearby schools including Turner Elementary School, Albany Middle School, and Dougherty Comprehensive High School.
Ownership History
Date
Name
Owned For
Owner Type
Purchase Details
Closed on
Feb 25, 2008
Sold by
Joanne Sherman-Moore
Bought by
Sherman-Moore Joanne and Moore Eddie B
Current Estimated Value
Purchase Details
Closed on
Oct 19, 2005
Sold by
Sherman Joanne M
Bought by
Joanne Sherman-Moore
Home Financials for this Owner
Home Financials are based on the most recent Mortgage that was taken out on this home.
Original Mortgage
$60,000
Interest Rate
10.25%
Mortgage Type
New Conventional
Purchase Details
Closed on
Jan 8, 1992
Sold by
Veterans Affairs
Bought by
Sherman Joanne M
Purchase Details
Closed on
Feb 20, 1991
Sold by
Trust Co Bank So Ga
Bought by
Veteran'S Affairs
Purchase Details
Closed on
Feb 12, 1991
Sold by
Browne Rev Doc Inc
Bought by
Trust Co Bank So Ga
Purchase Details
Closed on
Dec 31, 1984
Sold by
Thornton Joseph
Bought by
Browne Rev Doc Inc
Create a Home Valuation Report for This Property
The Home Valuation Report is an in-depth analysis detailing your home's value as well as a comparison with similar homes in the area
Purchase History
| Date | Buyer | Sale Price | Title Company |
|---|---|---|---|
| Sherman-Moore Joanne | -- | -- | |
| Joanne Sherman-Moore | -- | -- | |
| Sherman Joanne M | -- | -- | |
| Veteran'S Affairs | $40,500 | -- | |
| Trust Co Bank So Ga | $40,500 | -- | |
| Browne Rev Doc Inc | -- | -- |
Source: Public Records
Mortgage History
| Date | Status | Borrower | Loan Amount |
|---|---|---|---|
| Previous Owner | Joanne Sherman-Moore | $60,000 |
Source: Public Records
Tax History
| Year | Tax Paid | Tax Assessment Tax Assessment Total Assessment is a certain percentage of the fair market value that is determined by local assessors to be the total taxable value of land and additions on the property. | Land | Improvement |
|---|---|---|---|---|
| 2025 | $1,098 | $28,520 | $2,960 | $25,560 |
| 2024 | $1,098 | $28,520 | $2,960 | $25,560 |
| 2023 | $1,319 | $28,520 | $2,960 | $25,560 |
| 2022 | $1,322 | $28,520 | $2,960 | $25,560 |
| 2021 | $1,223 | $28,520 | $2,960 | $25,560 |
| 2020 | $1,225 | $28,520 | $2,960 | $25,560 |
| 2019 | $1,228 | $28,520 | $2,960 | $25,560 |
| 2018 | $1,231 | $28,520 | $2,960 | $25,560 |
| 2017 | $1,146 | $28,520 | $2,960 | $25,560 |
| 2016 | $1,147 | $28,520 | $2,960 | $25,560 |
| 2015 | $1,149 | $28,520 | $2,960 | $25,560 |
| 2014 | $1,133 | $28,520 | $2,960 | $25,560 |
Source: Public Records
Map
Nearby Homes
- 3030 E Park Ct
- 3028 E Park Ct
- 3031 E Park Ct
- 3029 E Park Ct
- 3027 E Park Ct
- 3024 E Park Ct
- 3024 War Eagle Ave
- 3022 E Park Ct
- 3023 E Park Ct
- 3020 E Park Ct
- 3021 E Park Ct
- 3018 War Eagle Ave
- 3018 E Park Ct
- 3019 E Park Ct
- 3101 War Eagle Ave
- 3016 War Eagle Ave
- 3103 War Eagle Ave
- 3016 E Park Ct
- 3017 E Park Ct
- E E Park Ct
Your Personal Tour Guide
Ask me questions while you tour the home.