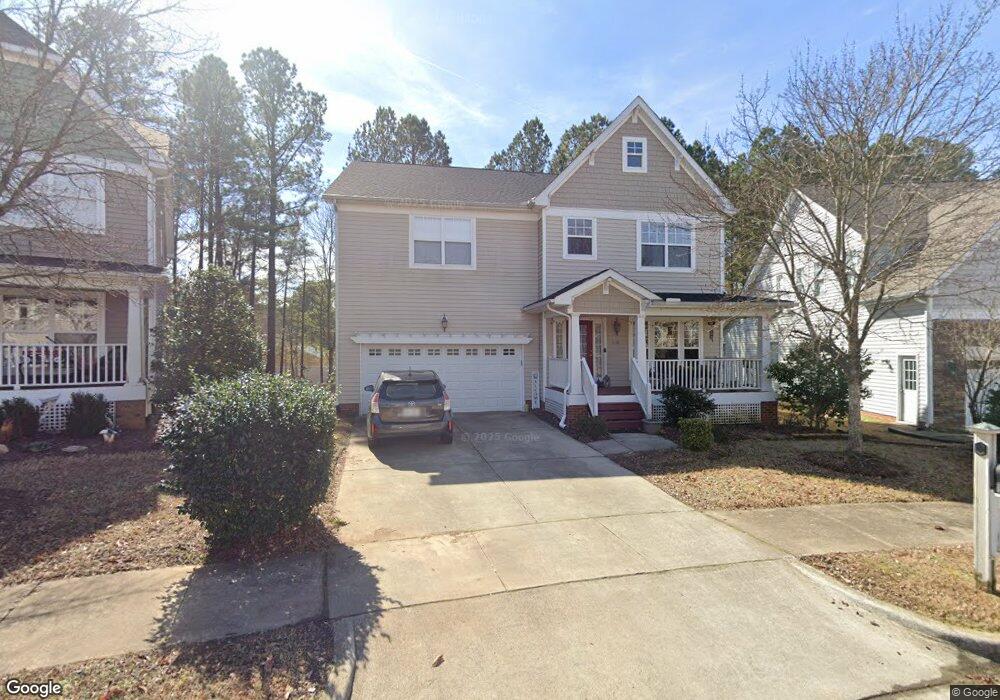
3032 Kilarney Ridge Loop Cary, NC 27511
South Cary NeighborhoodEstimated Value: $621,000 - $1,175,000
5
Beds
3
Baths
3,367
Sq Ft
$234/Sq Ft
Est. Value
About This Home
This home is located at 3032 Kilarney Ridge Loop, Cary, NC 27511 and is currently estimated at $788,697, approximately $234 per square foot. 3032 Kilarney Ridge Loop is a home located in Wake County with nearby schools including Laurel Park Elementary, Salem Middle, and Apex High School.
Ownership History
Date
Name
Owned For
Owner Type
Purchase Details
Closed on
Sep 27, 2019
Sold by
Joseph Dominic and Joseph Mini
Bought by
Kitsy Abderrazak and Ouhaddouch Khadija
Current Estimated Value
Home Financials for this Owner
Home Financials are based on the most recent Mortgage that was taken out on this home.
Original Mortgage
$306,650
Outstanding Balance
$268,013
Interest Rate
3.6%
Mortgage Type
Purchase Money Mortgage
Estimated Equity
$520,684
Purchase Details
Closed on
Oct 24, 2006
Sold by
K Hovnanian Homes Of North Carolina Inc
Bought by
Joseph Dominic and Dominic Mini
Home Financials for this Owner
Home Financials are based on the most recent Mortgage that was taken out on this home.
Original Mortgage
$48,900
Interest Rate
6.39%
Mortgage Type
Unknown
Purchase Details
Closed on
Nov 17, 2005
Sold by
Laurel Island Partners Llc
Bought by
K Hovnanian Homes Of North Carolina Inc
Create a Home Valuation Report for This Property
The Home Valuation Report is an in-depth analysis detailing your home's value as well as a comparison with similar homes in the area
Home Values in the Area
Average Home Value in this Area
Purchase History
We collect this data history from publicly available records. To have your information removed, we recommend requesting removal directly through your county’s website.
| Date | Buyer | Sale Price | Title Company |
|---|---|---|---|
| Kitsy Abderrazak | $409,000 | None Available | |
| Joseph Dominic | $326,500 | None Available | |
| K Hovnanian Homes Of North Carolina Inc | $1,008,000 | None Available |
Source: Public Records
Mortgage History
We collect this data history from publicly available records. To have your information removed, we recommend requesting removal directly through your county’s website.
| Date | Status | Borrower | Loan Amount |
|---|---|---|---|
| Open | Kitsy Abderrazak | $306,650 | |
| Previous Owner | Joseph Dominic | $48,900 | |
| Previous Owner | Joseph Dominic | $260,800 |
Source: Public Records
Tax History
| Year | Tax Paid | Tax Assessment Tax Assessment Total Assessment is a certain percentage of the fair market value that is determined by local assessors to be the total taxable value of land and additions on the property. | Land | Improvement |
|---|---|---|---|---|
| 2025 | $5,719 | $664,973 | $160,000 | $504,973 |
| 2024 | $5,596 | $664,973 | $160,000 | $504,973 |
| 2023 | $4,046 | $401,843 | $90,000 | $311,843 |
| 2022 | $3,896 | $401,843 | $90,000 | $311,843 |
| 2021 | $3,817 | $401,843 | $90,000 | $311,843 |
| 2020 | $3,838 | $401,843 | $90,000 | $311,843 |
| 2019 | $3,641 | $338,226 | $90,000 | $248,226 |
| 2018 | $0 | $338,226 | $90,000 | $248,226 |
| 2017 | $0 | $338,226 | $90,000 | $248,226 |
| 2016 | $0 | $338,226 | $90,000 | $248,226 |
| 2015 | -- | $333,031 | $86,000 | $247,031 |
| 2014 | -- | $333,031 | $86,000 | $247,031 |
Source: Public Records
Map
Nearby Homes
- 1016 Kilarney Ridge Loop
- 1608 Burnley Dr
- 1748 Laurel Park Place
- 1061 Monmouth Loop
- 1756 Laurel Park Place
- 1757 Laurel Park Place
- 116 Carostone Ct
- 1806 Tarbert Dr
- 110 Lost Tree Ln
- 104 Lost Tree Ln
- 416 Center Pointe Dr
- 113 Arvo Ln
- 619 Laurel Berry Ct
- 701 Edgewater Ridge Ct
- 203 Arvo Ln
- 864 Bay Bouquet Ln
- 307 Wax Myrtle Ct
- 842 Salem Pointe Place
- 119 Moravia Ln
- 106 Sarabande Dr
- 3034 Kilarney Ridge Loop
- 3036 Kilarney Ridge Loop
- 3030 Kilarney Ridge Loop
- 3038 Kilarney Ridge Loop
- 104 Castle Bay Ct
- 3039 Kilarney Ridge Loop
- 106 Castle Bay Ct
- 108 Castle Bay Ct
- 102 Castle Bay Ct
- 3041 Kilarney Ridge Loop
- 3042 Kilarney Ridge Loop
- 132 Loch Lomond Cir
- 130 Loch Lomond Cir
- 3024 Kilarney Ridge Loop
- 3043 Kilarney Ridge Loop
- 110 Castle Bay Ct
- 128 Loch Lomond Cir
- 3022 Kilarney Ridge Loop
- 3044 Kilarney Ridge Loop
- 3045 Kilarney Ridge Loop
Your Personal Tour Guide
Ask me questions while you tour the home.