Estimated Value: $158,468 - $287,000
3
Beds
1
Bath
1,835
Sq Ft
$128/Sq Ft
Est. Value
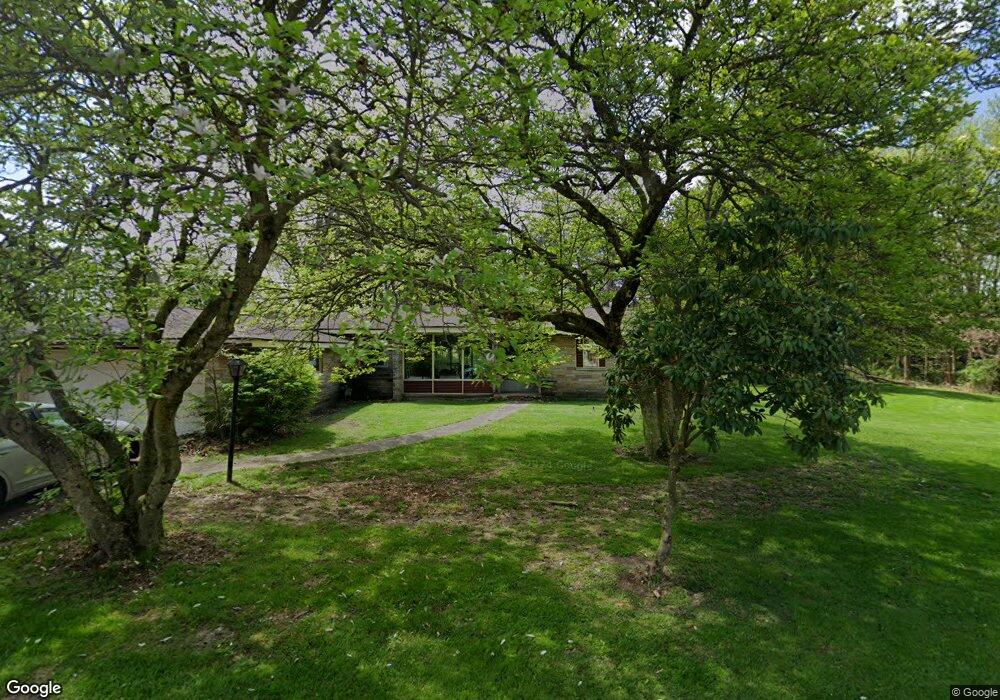
About This Home
This home is located at 3032 Lake James Dr, Akron, OH 44312 and is currently estimated at $235,367, approximately $128 per square foot. 3032 Lake James Dr is a home located in Summit County with nearby schools including Springfield High School and Summit Academy Akron Elementary School.
Ownership History
Date
Name
Owned For
Owner Type
Purchase Details
Closed on
Sep 27, 2011
Sold by
Kmeyer Shelly and Kmeyer Larry L
Bought by
Miller Michelle M
Current Estimated Value
Home Financials for this Owner
Home Financials are based on the most recent Mortgage that was taken out on this home.
Original Mortgage
$94,400
Outstanding Balance
$64,509
Interest Rate
4.14%
Mortgage Type
Purchase Money Mortgage
Estimated Equity
$170,858
Purchase Details
Closed on
Aug 5, 2011
Sold by
Kmeyer Larry L
Bought by
Kmyer Shelly
Home Financials for this Owner
Home Financials are based on the most recent Mortgage that was taken out on this home.
Original Mortgage
$94,400
Outstanding Balance
$64,509
Interest Rate
4.14%
Mortgage Type
Purchase Money Mortgage
Estimated Equity
$170,858
Purchase Details
Closed on
May 29, 1998
Sold by
Romo Marion Paul and Romo Helen
Bought by
Romo Helen L and The Helen L Romo Trust
Create a Home Valuation Report for This Property
The Home Valuation Report is an in-depth analysis detailing your home's value as well as a comparison with similar homes in the area
Home Values in the Area
Average Home Value in this Area
Purchase History
| Date | Buyer | Sale Price | Title Company |
|---|---|---|---|
| Miller Michelle M | $118,000 | Wigley Title Agency Inc | |
| Kmyer Shelly | -- | Wigley Title Agency Inc | |
| Romo Helen L | -- | -- |
Source: Public Records
Mortgage History
| Date | Status | Borrower | Loan Amount |
|---|---|---|---|
| Open | Miller Michelle M | $94,400 |
Source: Public Records
Tax History Compared to Growth
Tax History
| Year | Tax Paid | Tax Assessment Tax Assessment Total Assessment is a certain percentage of the fair market value that is determined by local assessors to be the total taxable value of land and additions on the property. | Land | Improvement |
|---|---|---|---|---|
| 2025 | $1,612 | $32,215 | $29,859 | $2,356 |
| 2024 | $1,612 | $32,215 | $29,859 | $2,356 |
| 2023 | $1,612 | $32,215 | $29,859 | $2,356 |
| 2022 | $1,358 | $23,429 | $21,175 | $2,254 |
| 2021 | $1,334 | $23,429 | $21,175 | $2,254 |
| 2020 | $1,351 | $23,430 | $21,180 | $2,250 |
| 2019 | $1,378 | $22,670 | $21,180 | $1,490 |
| 2018 | $1,358 | $22,670 | $21,180 | $1,490 |
| 2017 | $2,500 | $33,610 | $21,180 | $12,430 |
| 2016 | $2,525 | $40,870 | $21,180 | $19,690 |
| 2015 | $2,500 | $40,870 | $21,180 | $19,690 |
| 2014 | $2,293 | $40,870 | $21,180 | $19,690 |
| 2013 | $2,708 | $47,960 | $21,180 | $26,780 |
Source: Public Records
Map
Nearby Homes
- 2851 Roanoke Ave
- 1605 Pawnee Blvd
- V/L Sanitarium Rd
- 0 Grace Rd
- 3134 Shelton Ct
- 3191 Castleton Ct
- 2923 Hayne Rd
- 847 Bristol Dr
- Aruba Bay w/ Basement Plan at Hidden Lake Villages - Hidden Lakes Ranches
- Grand Bahama w/ Basement Plan at Hidden Lake Villages - Hidden Lakes Ranches
- Eden Cay w/ Basement Plan at Hidden Lake Villages - Hidden Lakes Ranches
- Grand Cayman w/ Basement Plan at Hidden Lake Villages - Hidden Lakes Ranches
- 1341 Valley Dr
- 0 Canton Rd Unit 5124723
- 2645 Hayne Rd
- 1002 Bookman Ave
- 2643 Monroe St
- 3362 Brentwood Dr
- 1011 Sunrise Way
- 2526 South St
- 3011 Lake James Dr
- 3042 Lake James Dr
- 3026 Lake James Terrace
- 3029 Lake James Dr
- 3044 Lake James Terrace
- 3058 Lake James Dr
- 3105 Lake James Dr
- 2100 Canton Rd
- 2130 Canton Rd
- 2020 Canton Rd
- 2036 Canton Rd
- 1399 Seneca Ave
- 1399 Seneca Ave
- 2000 Canton Rd
- 2014 Canton Rd
- 2014 Canton Rd
- 1970 Canton Rd
- 1960 Canton Rd
- 1952 Canton Rd
- 2029 Canton Rd