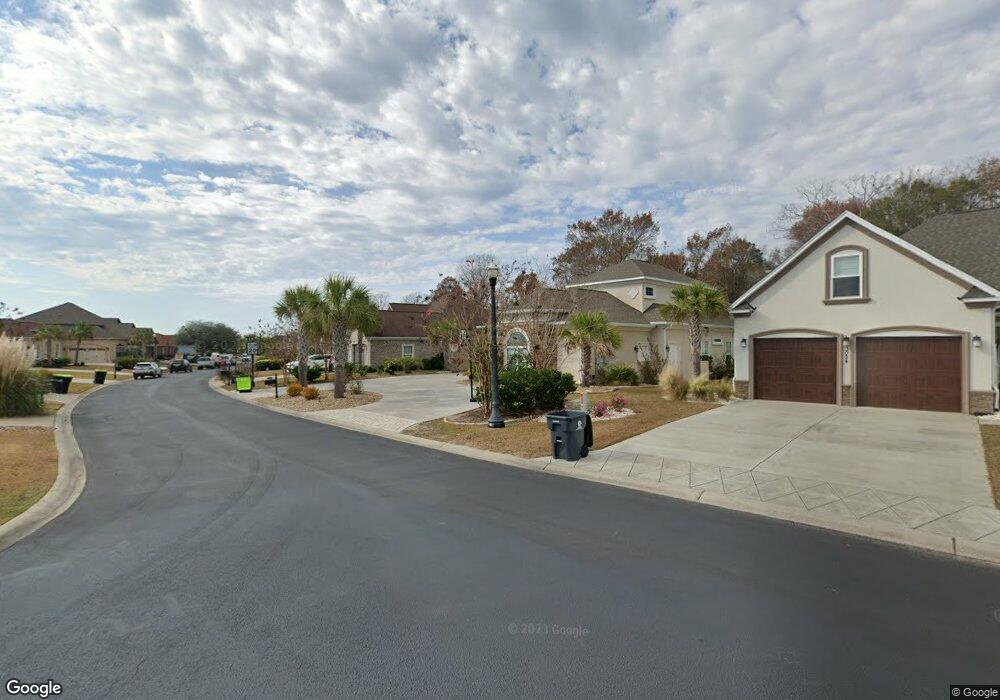
3032 Marsh Island Dr Unit Lot 182 Myrtle Beach, SC 29579
Estimated Value: $630,296 - $770,000
4
Beds
3
Baths
2,456
Sq Ft
$283/Sq Ft
Est. Value
About This Home
This home is located at 3032 Marsh Island Dr Unit Lot 182, Myrtle Beach, SC 29579 and is currently estimated at $694,574, approximately $282 per square foot. 3032 Marsh Island Dr Unit Lot 182 is a home located in Horry County with nearby schools including River Oaks Elementary School, Ocean Bay Middle School, and Carolina Forest High School.
Ownership History
Date
Name
Owned For
Owner Type
Purchase Details
Closed on
Feb 11, 2020
Sold by
Finney Daniel S
Bought by
Bowers Keith A and Bowers Connie L
Current Estimated Value
Home Financials for this Owner
Home Financials are based on the most recent Mortgage that was taken out on this home.
Original Mortgage
$240,000
Outstanding Balance
$189,891
Interest Rate
3.74%
Mortgage Type
New Conventional
Estimated Equity
$504,683
Purchase Details
Closed on
Dec 16, 2015
Sold by
Iftm Llc
Bought by
Finney Daniel S and Finney Gail A
Home Financials for this Owner
Home Financials are based on the most recent Mortgage that was taken out on this home.
Original Mortgage
$292,500
Interest Rate
3.98%
Purchase Details
Closed on
Dec 5, 2014
Sold by
Abercrombie Drema L
Bought by
Iftm Llc
Purchase Details
Closed on
Nov 13, 2003
Sold by
The Bluffs On The Waterway Llc
Bought by
Abercrombie Drema L
Create a Home Valuation Report for This Property
The Home Valuation Report is an in-depth analysis detailing your home's value as well as a comparison with similar homes in the area
Home Values in the Area
Average Home Value in this Area
Purchase History
| Date | Buyer | Sale Price | Title Company |
|---|---|---|---|
| Bowers Keith A | $380,000 | -- | |
| Finney Daniel S | $390,000 | -- | |
| Iftm Llc | $65,000 | -- | |
| Abercrombie Drema L | $72,880 | -- |
Source: Public Records
Mortgage History
| Date | Status | Borrower | Loan Amount |
|---|---|---|---|
| Open | Bowers Keith A | $240,000 | |
| Previous Owner | Finney Daniel S | $292,500 |
Source: Public Records
Tax History Compared to Growth
Tax History
| Year | Tax Paid | Tax Assessment Tax Assessment Total Assessment is a certain percentage of the fair market value that is determined by local assessors to be the total taxable value of land and additions on the property. | Land | Improvement |
|---|---|---|---|---|
| 2024 | $1,507 | $25,671 | $5,651 | $20,020 |
| 2023 | $1,507 | $22,716 | $6,126 | $16,590 |
| 2021 | $4,922 | $15,144 | $4,084 | $11,060 |
| 2020 | $1,499 | $16,724 | $4,084 | $12,640 |
| 2019 | $1,499 | $16,724 | $4,084 | $12,640 |
| 2018 | $0 | $15,401 | $2,545 | $12,856 |
| 2017 | $1,409 | $15,401 | $2,545 | $12,856 |
| 2016 | -- | $15,401 | $2,545 | $12,856 |
| 2015 | $819 | $3,818 | $3,818 | $0 |
| 2014 | $569 | $2,738 | $2,738 | $0 |
Source: Public Records
Map
Nearby Homes
- 3129 Marsh Island Dr
- 3149 Marsh Island Dr
- 961 Bluffview Dr
- 185 Avenue of the Palms
- 914 Bluffview Dr
- 230 Avenue of the Palms
- 234 Avenue of the Palms
- 8016 Bird Key Ct
- 937 Bluffview Dr
- 4861 Luster Leaf Cir Unit 301
- 969 Bluffview Dr
- 4869 Luster Leaf Cir Unit 104
- 4855 Luster Leaf Cir Unit 303
- 4851 Luster Leaf Cir Unit 301
- 4828 Magnolia Lake Dr Unit 103
- 4875 Luster Leaf Cir Unit 301
- 4847 Luster Leaf Cir Unit 403
- 4847 Luster Leaf Cir Unit 301
- 4847 Luster Leaf Cir Unit 401 Magnolia Pointe
- 719 Edgecreek Dr
- 3032 Marsh Island Dr
- 3028 Marsh Island Dr
- 3038 Marsh Island Dr
- Lot 232 Marsh Island Dr Unit The Bluffs on the Wa
- Lot 230 Marsh Island Dr
- Lot 234 Marsh Island Dr
- Lot 234 Marsh Island Dr Unit Lot 234 The Bluffs o
- Lot 218 Marsh Island
- Lot 174 Marsh Island
- Lot 197 Marsh Island Dr
- Lot 196 Marsh Island Dr
- Lot 236 Marsh Island Dr
- Lot 176 Marsh Island Dr
- Lot 176 Marsh Island Dr Unit Lot 176 The Bluffs o
- Lot 181 Marsh Island Dr Unit The Bluffs on the Wa
- Lot 181 Marsh Island Dr
- 3024 Marsh Island Dr
- 3024 Marsh Island Dr Unit The Bluffs on the Wa
- 3044 Marsh Island Dr
- 3048 Marsh Island Dr