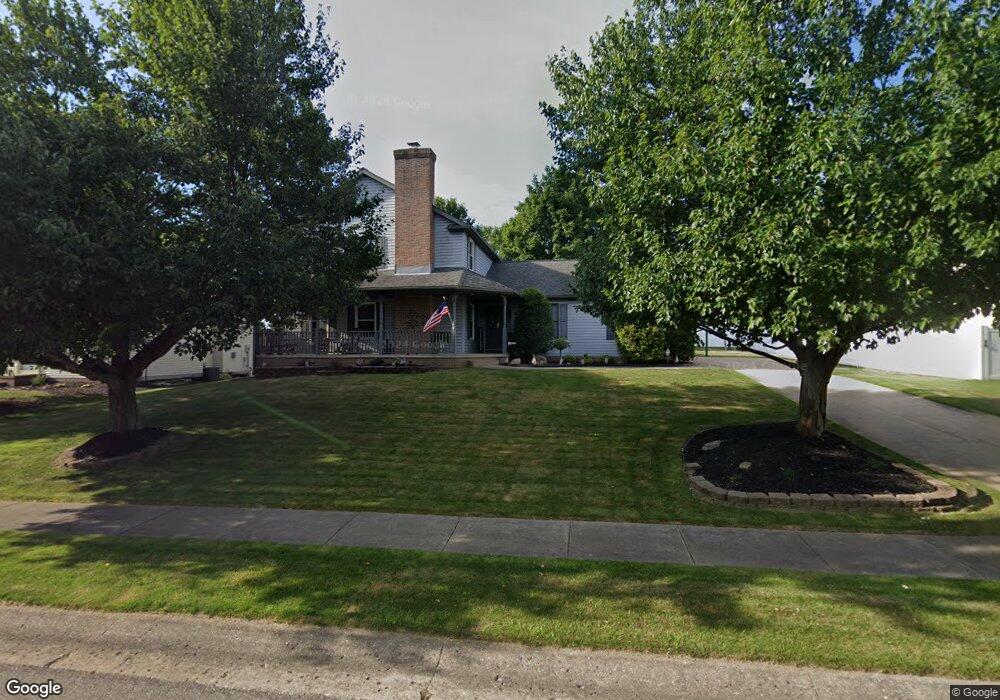
3032 Shillington St NW Uniontown, OH 44685
Estimated Value: $351,832 - $391,000
3
Beds
3
Baths
2,172
Sq Ft
$172/Sq Ft
Est. Value
About This Home
This home is located at 3032 Shillington St NW, Uniontown, OH 44685 and is currently estimated at $374,458, approximately $172 per square foot. 3032 Shillington St NW is a home located in Stark County with nearby schools including North Canton Middle School, Hoover High School, and Lake Center Christian School.
Ownership History
Date
Name
Owned For
Owner Type
Purchase Details
Closed on
Jul 15, 2006
Sold by
Brian Richard G and Cross Brian Michele
Bought by
Litka Eleanor R
Current Estimated Value
Home Financials for this Owner
Home Financials are based on the most recent Mortgage that was taken out on this home.
Original Mortgage
$145,500
Outstanding Balance
$86,761
Interest Rate
6.73%
Mortgage Type
Purchase Money Mortgage
Estimated Equity
$287,697
Purchase Details
Closed on
May 15, 1996
Sold by
Aspen Homes Inc
Bought by
Brian Richard G and Brian Michele
Home Financials for this Owner
Home Financials are based on the most recent Mortgage that was taken out on this home.
Original Mortgage
$129,900
Interest Rate
7.86%
Mortgage Type
New Conventional
Purchase Details
Closed on
Aug 29, 1995
Sold by
Chatham Dev Corp
Bought by
Aspen Homes Inc
Create a Home Valuation Report for This Property
The Home Valuation Report is an in-depth analysis detailing your home's value as well as a comparison with similar homes in the area
Home Values in the Area
Average Home Value in this Area
Purchase History
| Date | Buyer | Sale Price | Title Company |
|---|---|---|---|
| Litka Eleanor R | $194,000 | Trident Title Agency Inc | |
| Brian Richard G | $169,900 | -- | |
| Aspen Homes Inc | $28,000 | -- |
Source: Public Records
Mortgage History
| Date | Status | Borrower | Loan Amount |
|---|---|---|---|
| Open | Litka Eleanor R | $145,500 | |
| Previous Owner | Brian Richard G | $129,900 |
Source: Public Records
Tax History Compared to Growth
Tax History
| Year | Tax Paid | Tax Assessment Tax Assessment Total Assessment is a certain percentage of the fair market value that is determined by local assessors to be the total taxable value of land and additions on the property. | Land | Improvement |
|---|---|---|---|---|
| 2025 | -- | $110,740 | $23,590 | $87,150 |
| 2024 | -- | $110,740 | $23,590 | $87,150 |
| 2023 | $4,485 | $82,250 | $18,760 | $63,490 |
| 2022 | $4,307 | $82,250 | $18,760 | $63,490 |
| 2021 | $4,428 | $82,250 | $18,760 | $63,490 |
| 2020 | $4,263 | $72,210 | $16,170 | $56,040 |
| 2019 | $4,001 | $72,210 | $16,170 | $56,040 |
| 2018 | $4,144 | $72,210 | $16,170 | $56,040 |
| 2017 | $3,343 | $60,980 | $13,760 | $47,220 |
| 2016 | $3,356 | $60,980 | $13,760 | $47,220 |
| 2015 | $3,370 | $60,980 | $13,760 | $47,220 |
| 2014 | $1,311 | $56,670 | $12,810 | $43,860 |
| 2013 | $1,657 | $56,670 | $12,810 | $43,860 |
Source: Public Records
Map
Nearby Homes
- 10531 Newbury Ave NW
- 3048 Wright Rd NW
- 3026 Wright Rd NW
- 10380 Sudbury Cir NW
- 11316 Cleveland Ave NW
- 11056 Peach Glen Ave NW
- 10044 Cleveland Ave NW
- 3851 Cromford Cir NW
- 11065 Dunsby Ave NW
- 3863 Heckman St NW
- 3648 Mulberry St NW
- 2601 Lake Center St NW
- 9760 Summerset Ave NW
- 3322 Perrydale St NW
- 3047 Chalford Cir NW Unit 46B
- 2709 Country Squire St NW
- 9520-9570 Cleveland Ave NW
- 1771 Midway St NW
- 9364 Pheasant Valley Ave NW
- 12235 Cantburg Ave NW
- 3046 Shillington St NW
- 3012 Shillington St NW
- 10788 Thoresby Cir NW
- 10775 Mogadore Ave NW
- 10834 Thoresby Cir NW
- 10821 Mogadore Ave NW
- 10761 Mogadore Ave NW
- 10774 Thoresby Cir NW
- 3074 Shillington St NW
- 10843 Mogadore Ave NW
- 10856 Thoresby Cir NW
- 10745 Mogadore Ave NW
- 10764 Thoresby Cir NW
- 10800 Mogadore Ave NW
- 10783 Thoresby Cir NW
- 3075 Shillington St NW
- 10820 Mogadore Ave NW
- 10870 Thoresby Cir NW
- 10859 Mogadore Ave NW
- 3096 Shillington St NW