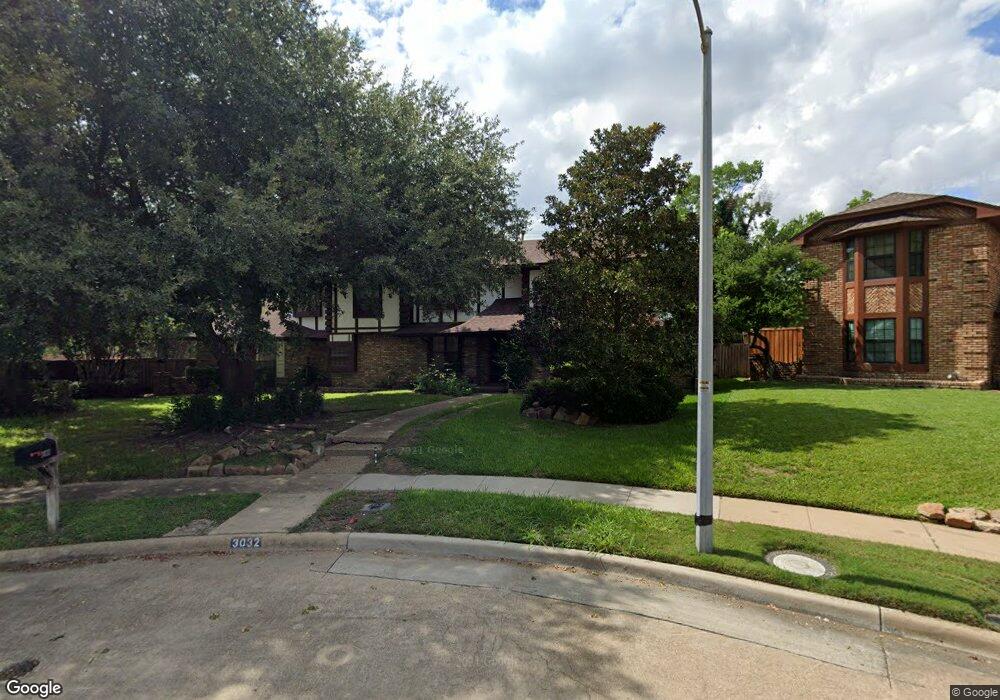
3032 Tahoe Place Plano, TX 75023
Hughston NeighborhoodEstimated Value: $578,000 - $622,000
4
Beds
4
Baths
3,056
Sq Ft
$196/Sq Ft
Est. Value
About This Home
This home is located at 3032 Tahoe Place, Plano, TX 75023 and is currently estimated at $599,352, approximately $196 per square foot. 3032 Tahoe Place is a home located in Collin County with nearby schools including Hughston Elementary School, Haggard Middle School, and Plano Senior High School.
Ownership History
Date
Name
Owned For
Owner Type
Purchase Details
Closed on
May 29, 2020
Sold by
Brady Melissa
Bought by
Brady Christopher
Current Estimated Value
Home Financials for this Owner
Home Financials are based on the most recent Mortgage that was taken out on this home.
Original Mortgage
$90,000
Outstanding Balance
$79,927
Interest Rate
3.3%
Mortgage Type
Seller Take Back
Estimated Equity
$519,425
Purchase Details
Closed on
Oct 15, 1999
Sold by
Pallister Janet E and Estate Of Norman T Pallister
Bought by
Caldwell Brady Christopher A and Caldwell Brady Melissa
Home Financials for this Owner
Home Financials are based on the most recent Mortgage that was taken out on this home.
Original Mortgage
$153,600
Interest Rate
7.9%
Purchase Details
Closed on
Sep 15, 1997
Sold by
Aydelotte William E and Aydelotte Sangad
Bought by
Pallister Norman and Pallister Janet E
Create a Home Valuation Report for This Property
The Home Valuation Report is an in-depth analysis detailing your home's value as well as a comparison with similar homes in the area
Home Values in the Area
Average Home Value in this Area
Purchase History
| Date | Buyer | Sale Price | Title Company |
|---|---|---|---|
| Brady Christopher | -- | None Available | |
| Caldwell Brady Christopher A | -- | -- | |
| Pallister Norman | -- | -- |
Source: Public Records
Mortgage History
| Date | Status | Borrower | Loan Amount |
|---|---|---|---|
| Open | Brady Christopher | $90,000 | |
| Closed | Caldwell Brady Christopher A | $153,600 | |
| Closed | Caldwell Brady Christopher A | $28,800 |
Source: Public Records
Tax History Compared to Growth
Tax History
| Year | Tax Paid | Tax Assessment Tax Assessment Total Assessment is a certain percentage of the fair market value that is determined by local assessors to be the total taxable value of land and additions on the property. | Land | Improvement |
|---|---|---|---|---|
| 2025 | $6,885 | $511,525 | $129,600 | $381,925 |
| 2024 | $6,885 | $500,661 | $115,200 | $385,461 |
| 2023 | $6,885 | $464,067 | $115,200 | $386,534 |
| 2022 | $8,062 | $421,879 | $100,800 | $335,566 |
| 2021 | $7,734 | $383,808 | $76,800 | $307,008 |
| 2020 | $7,119 | $351,209 | $76,800 | $274,409 |
| 2019 | $6,851 | $316,964 | $76,800 | $273,904 |
| 2018 | $6,281 | $288,149 | $76,800 | $257,065 |
| 2017 | $5,710 | $304,906 | $57,600 | $247,306 |
| 2016 | $5,256 | $260,454 | $64,800 | $195,654 |
| 2015 | $4,476 | $216,491 | $54,000 | $162,491 |
Source: Public Records
Map
Nearby Homes
- 3104 Cross Bend Rd
- 3108 Landershire Ln
- 4009 Weyburn Place
- 2901 Crow Valley Trail
- 3816 Deep Valley Trail
- 3008 Dibrell Dr
- 2829 Lawndale Dr
- 2729 Deep Valley Trail
- 3317 Buckle Ln
- 3620 Hilltop Ln
- 3631 Hilltop Ln
- 3112 Phaeton Ct
- 2717 Landershire Ln
- 2800 Glen Forest Ln
- 2700 Cross Bend Rd
- 3314 Lanarc Dr
- 2701 Landershire Ln
- 3417 Cross Bend Rd
- 3409 Deep Valley Trail
- 2805 Loch Haven Dr
- 3028 Tahoe Place
- 3036 Tahoe Place
- 3024 Tahoe Place
- 3033 Tahoe Place
- 3035 Granada Place
- 3100 Cross Bend Rd
- 3200 Cassidy Dr
- 3031 Granada Place
- 3020 Tahoe Place
- 3204 Cassidy Dr
- 3029 Granada Place
- 3032 Cross Bend Rd
- 3028 Cross Bend Rd
- 3208 Cassidy Dr
- 3025 Granada Place
- 3024 Cross Bend Rd
- 3040 Granada Place
- 3847 Santiago Dr
- 3101 Cross Bend Rd
- 3016 Tahoe Place