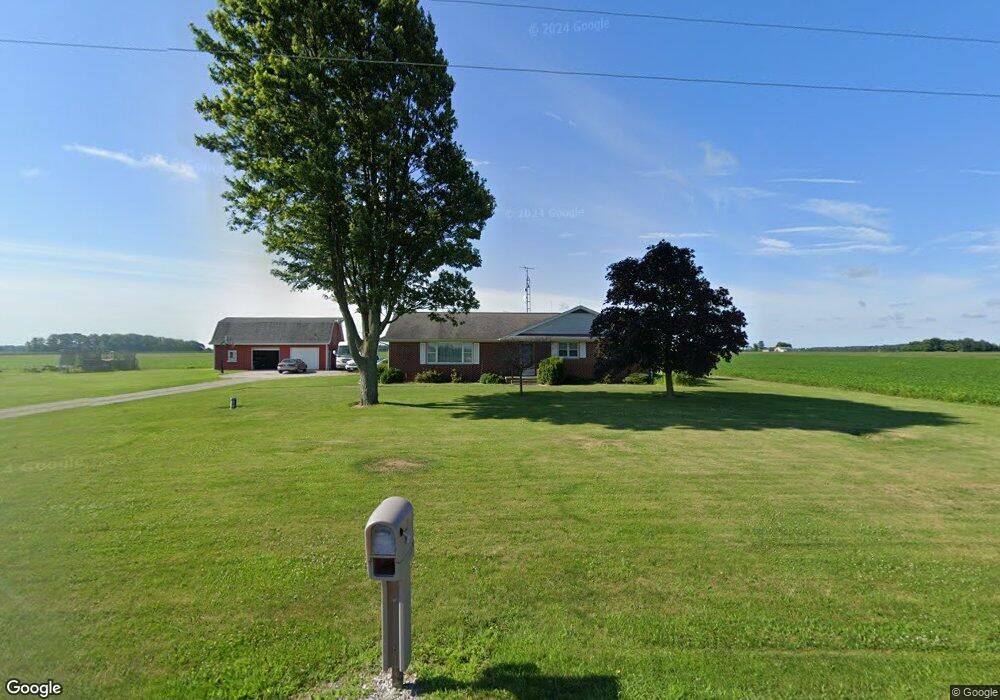
30336 Behrens Rd Defiance, OH 43512
Estimated Value: $288,253 - $335,000
3
Beds
2
Baths
1,762
Sq Ft
$178/Sq Ft
Est. Value
About This Home
This home is located at 30336 Behrens Rd, Defiance, OH 43512 and is currently estimated at $313,563, approximately $177 per square foot. 30336 Behrens Rd is a home located in Defiance County with nearby schools including Tinora Elementary School, Noble Elementary School, and Tinora Middle School.
Ownership History
Date
Name
Owned For
Owner Type
Purchase Details
Closed on
Jun 24, 2011
Sold by
Rathge Linda L and Rathge Burdette
Bought by
Okuley Christopher S and Okuley Saunda L
Current Estimated Value
Home Financials for this Owner
Home Financials are based on the most recent Mortgage that was taken out on this home.
Original Mortgage
$126,080
Outstanding Balance
$3,864
Interest Rate
4.67%
Mortgage Type
New Conventional
Estimated Equity
$309,699
Purchase Details
Closed on
Nov 8, 2009
Sold by
Rathge Linda L
Bought by
Rathge Ella
Purchase Details
Closed on
Nov 3, 2009
Sold by
Rathge Ella
Bought by
Rathge Linda L and Rathge Burdette
Purchase Details
Closed on
Jan 1, 1997
Bought by
Okuley Christopher S and Okuley Saundra L
Purchase Details
Closed on
Mar 1, 1990
Bought by
Okuley Christopher S and Okuley Saundra L
Create a Home Valuation Report for This Property
The Home Valuation Report is an in-depth analysis detailing your home's value as well as a comparison with similar homes in the area
Purchase History
| Date | Buyer | Sale Price | Title Company |
|---|---|---|---|
| Okuley Christopher S | $157,600 | -- | |
| Rathge Ella | -- | -- | |
| Rathge Linda L | -- | -- | |
| Okuley Christopher S | -- | -- | |
| Okuley Christopher S | $84,500 | -- |
Source: Public Records
Mortgage History
| Date | Status | Borrower | Loan Amount |
|---|---|---|---|
| Open | Okuley Christopher S | $126,080 |
Source: Public Records
Tax History
| Year | Tax Paid | Tax Assessment Tax Assessment Total Assessment is a certain percentage of the fair market value that is determined by local assessors to be the total taxable value of land and additions on the property. | Land | Improvement |
|---|---|---|---|---|
| 2025 | $3,157 | $92,490 | $5,650 | $86,840 |
| 2024 | $3,157 | $92,490 | $5,650 | $86,840 |
| 2023 | $3,201 | $92,490 | $5,650 | $86,840 |
| 2022 | $2,138 | $52,320 | $5,260 | $47,060 |
| 2021 | $2,138 | $52,320 | $5,260 | $47,060 |
| 2020 | $2,147 | $52,320 | $5,260 | $47,060 |
| 2019 | $2,001 | $49,820 | $5,240 | $44,580 |
| 2018 | $2,058 | $49,820 | $5,240 | $44,580 |
| 2017 | $1,936 | $49,826 | $5,243 | $44,583 |
| 2016 | $1,834 | $49,217 | $5,201 | $44,016 |
| 2015 | $1,000 | $49,217 | $5,201 | $44,016 |
| 2014 | $1,000 | $49,217 | $5,201 | $44,016 |
| 2013 | $1,000 | $49,217 | $5,201 | $44,016 |
| 2012 | $1,000 | $49,217 | $5,201 | $44,016 |
Source: Public Records
Map
Nearby Homes
- 3541 Adams Ridge Rd
- 104 W High St
- 26825 Behrens Rd
- 8205 Independence Rd
- 150 Wayne Park Dr
- 140 Wayne Park Dr
- 155 Orchard Ln
- 1116 Hurst Dr
- 0 Westmoreland Ave
- 00 Westmoreland Ave
- 1123 Clairmont Ave
- 1113 Clairmont Ave
- 1314 Clairmont Ave
- 1324 Clairmont Ave
- S440 County Road 18
- 1304 Clairmont Ave
- 1354 Clairmont Ave
- 907 Huddle Rd
- 764 Clairmont Ave
- 538 Huddle Rd
- 5353 Egler Rd
- 29914 Behrens Rd
- 30370 Gerken Rd
- 30467 Banner School Rd
- 30820 Behrens Rd
- 30136 Gerken Rd
- 30224 Banner School Rd
- 30017 Banner School Rd
- 30413 Gerken Rd
- 30233 Gerken Rd
- 30767 Banner School Rd
- 30017 Gerken Rd
- 30843 Banner School Rd
- 6143 Egler Rd
- 29795 Banner School Rd
- 30779 Gerken Rd
- 29841 Gerken Rd
- N206 County Road 19
- 6200 Egler Rd
- 0 191 Unit 5083766
Your Personal Tour Guide
Ask me questions while you tour the home.