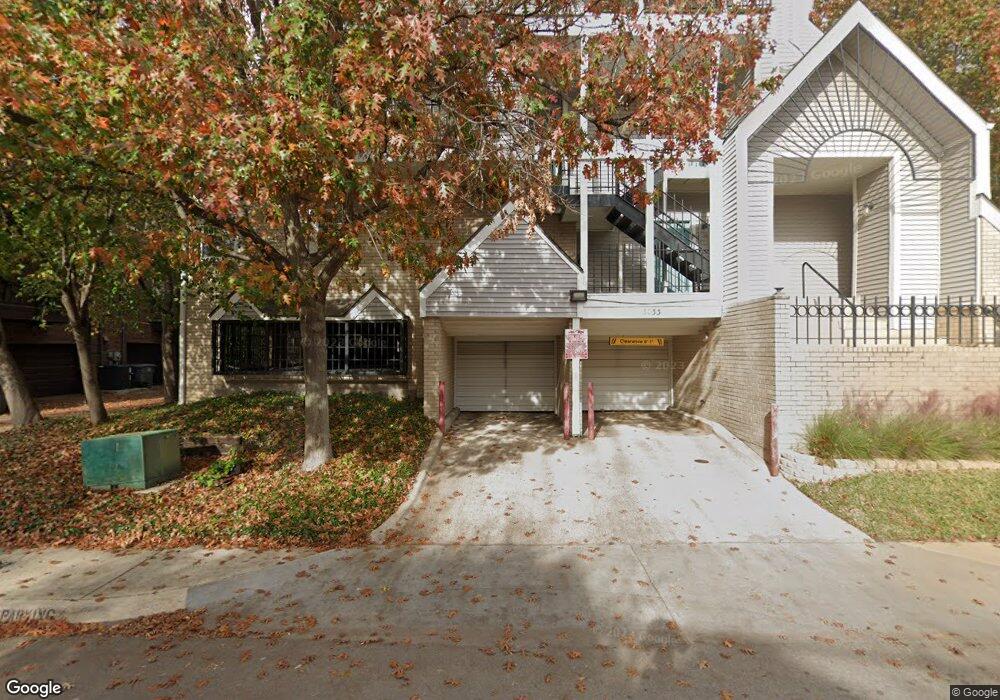
3033C San Jacinto St Unit 320 Dallas, TX 75204
Bryan Place NeighborhoodEstimated Value: $255,214 - $343,000
2
Beds
2
Baths
973
Sq Ft
$290/Sq Ft
Est. Value
About This Home
This home is located at 3033C San Jacinto St Unit 320, Dallas, TX 75204 and is currently estimated at $282,304, approximately $290 per square foot. 3033C San Jacinto St Unit 320 is a home located in Dallas County with nearby schools including Alex W. Spence Talented/Gifted Academy, North Dallas High School, and Pegasus School of Liberal Arts & Sciences.
Ownership History
Date
Name
Owned For
Owner Type
Purchase Details
Closed on
Apr 6, 2018
Sold by
Boksiner Gennady and Boksiner Margaret Aynsley
Bought by
Clytus Tiara N
Current Estimated Value
Home Financials for this Owner
Home Financials are based on the most recent Mortgage that was taken out on this home.
Original Mortgage
$238,450
Outstanding Balance
$204,872
Interest Rate
4.4%
Mortgage Type
New Conventional
Estimated Equity
$77,432
Purchase Details
Closed on
Oct 27, 2006
Sold by
Ramsey Cris A
Bought by
Boksiner Gennady
Home Financials for this Owner
Home Financials are based on the most recent Mortgage that was taken out on this home.
Original Mortgage
$104,700
Interest Rate
6.37%
Mortgage Type
Purchase Money Mortgage
Create a Home Valuation Report for This Property
The Home Valuation Report is an in-depth analysis detailing your home's value as well as a comparison with similar homes in the area
Home Values in the Area
Average Home Value in this Area
Purchase History
| Date | Buyer | Sale Price | Title Company |
|---|---|---|---|
| Clytus Tiara N | -- | Capital Title | |
| Boksiner Gennady | -- | Atc |
Source: Public Records
Mortgage History
| Date | Status | Borrower | Loan Amount |
|---|---|---|---|
| Open | Clytus Tiara N | $238,450 | |
| Previous Owner | Boksiner Gennady | $104,700 |
Source: Public Records
Tax History Compared to Growth
Tax History
| Year | Tax Paid | Tax Assessment Tax Assessment Total Assessment is a certain percentage of the fair market value that is determined by local assessors to be the total taxable value of land and additions on the property. | Land | Improvement |
|---|---|---|---|---|
| 2025 | $5,654 | $262,710 | $46,860 | $215,850 |
| 2024 | $5,654 | $252,980 | $46,860 | $206,120 |
| 2023 | $5,654 | $243,250 | $46,860 | $196,390 |
| 2022 | $6,082 | $243,250 | $46,860 | $196,390 |
| 2021 | $6,417 | $243,250 | $46,860 | $196,390 |
| 2020 | $6,599 | $243,250 | $37,490 | $205,760 |
| 2019 | $6,819 | $239,660 | $32,800 | $206,860 |
| 2018 | $6,517 | $239,660 | $32,800 | $206,860 |
| 2017 | $5,027 | $184,870 | $28,120 | $156,750 |
| 2016 | $4,763 | $175,140 | $37,490 | $137,650 |
| 2015 | $2,610 | $131,360 | $28,120 | $103,240 |
| 2014 | $2,610 | $120,650 | $18,740 | $101,910 |
Source: Public Records
Map
Nearby Homes
- 1010 Allen St Unit 213B
- 1010 Allen St Unit 217B
- 3105 San Jacinto St Unit 119C
- 923 Liberty St
- 1016 Liberty St Unit 2
- 3105 San Jacinto St Unit 212
- 3105 San Jacinto St Unit 205
- 3105 San Jacinto St Unit 104A
- 3105 San Jacinto St Unit 106
- 919 Liberty Ct
- 1012 Pavillion St
- 3200 Ross Ave Unit 40
- 3200 Ross Ave Unit 28
- 3200 Ross Ave Unit 22
- 3200 Ross Ave Unit 36
- 3200 Ross Ave Unit 42
- 3200 Ross Ave Unit 15
- 3200 Ross Ave Unit 1
- 3004 Zenia Dr
- 1717 Arts Plaza Unit 2204
- 1001 Liberty St Unit 125
- 1010 Allen St Unit 221
- 1010 Allen St
- 1001 Liberty St Unit 122A
- 1010B Allen St Unit 231
- 3033 San Jacinto St Unit 322C
- 3033 San Jacinto St Unit 314C
- 3033 San Jacinto St Unit 327C
- 3033 San Jacinto St Unit 310C
- 3033 San Jacinto St Unit 321C
- 1001 Liberty St Unit 123A
- 1010 Allen St Unit 210B
- 1010 Allen St Unit 226B
- 1010 Allen St Unit 220B
- 1001 Liberty St Unit 126A
- 1010 Allen St Unit 224B
- 1001 Liberty St Unit 114A
- 3033C San Jacinto St Unit 328
- 3033 San Jacinto St Unit 326C
- 3033 San Jacinto St Unit 325C