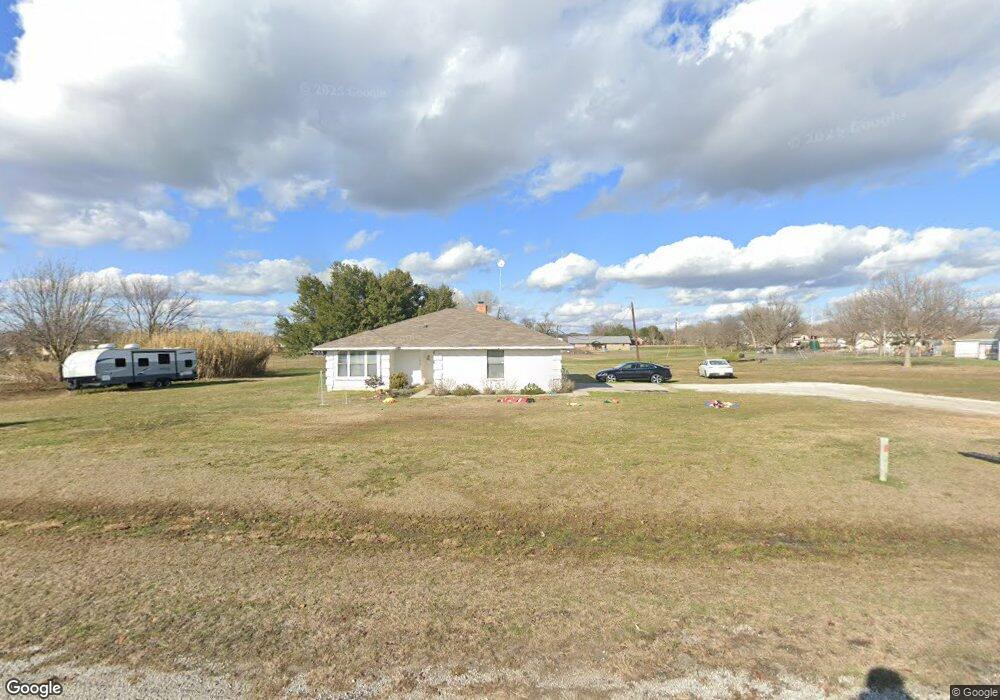
3034 Dusk Dr Weatherford, TX 76088
Estimated Value: $338,180 - $389,000
3
Beds
2
Baths
1,551
Sq Ft
$237/Sq Ft
Est. Value
About This Home
This home is located at 3034 Dusk Dr, Weatherford, TX 76088 and is currently estimated at $368,045, approximately $237 per square foot. 3034 Dusk Dr is a home located in Parker County with nearby schools including Peaster Elementary School, Peaster Middle School, and Peaster High School.
Ownership History
Date
Name
Owned For
Owner Type
Purchase Details
Closed on
Dec 10, 2020
Sold by
Rucker Michael and Rucker Maci
Bought by
Coleman Gage
Current Estimated Value
Home Financials for this Owner
Home Financials are based on the most recent Mortgage that was taken out on this home.
Original Mortgage
$9,230
Outstanding Balance
$8,219
Interest Rate
2.71%
Mortgage Type
FHA
Estimated Equity
$359,826
Purchase Details
Closed on
Jan 28, 2019
Sold by
Livingston Shana De Ann and Clark Kyle Scott
Bought by
Rucker Maci and Rucker Mitchael
Home Financials for this Owner
Home Financials are based on the most recent Mortgage that was taken out on this home.
Original Mortgage
$164,326
Interest Rate
5.75%
Mortgage Type
FHA
Purchase Details
Closed on
May 14, 1991
Bought by
Clark Shirley
Create a Home Valuation Report for This Property
The Home Valuation Report is an in-depth analysis detailing your home's value as well as a comparison with similar homes in the area
Home Values in the Area
Average Home Value in this Area
Purchase History
| Date | Buyer | Sale Price | Title Company |
|---|---|---|---|
| Coleman Gage | -- | Alamo Title Company | |
| Rucker Maci | -- | None Available | |
| Clark Shirley | -- | -- |
Source: Public Records
Mortgage History
| Date | Status | Borrower | Loan Amount |
|---|---|---|---|
| Open | Coleman Gage | $9,230 | |
| Open | Coleman Gage | $230,743 | |
| Previous Owner | Rucker Maci | $164,326 |
Source: Public Records
Tax History Compared to Growth
Tax History
| Year | Tax Paid | Tax Assessment Tax Assessment Total Assessment is a certain percentage of the fair market value that is determined by local assessors to be the total taxable value of land and additions on the property. | Land | Improvement |
|---|---|---|---|---|
| 2025 | $3,361 | $285,838 | -- | -- |
| 2024 | $3,361 | $259,853 | -- | -- |
| 2023 | $3,361 | $275,560 | $58,630 | $216,930 |
| 2022 | $4,283 | $214,760 | $43,580 | $171,180 |
| 2021 | $4,317 | $214,760 | $43,580 | $171,180 |
| 2020 | $4,353 | $212,260 | $26,890 | $185,370 |
| 2019 | $4,574 | $212,260 | $26,890 | $185,370 |
| 2018 | $3,299 | $152,630 | $20,000 | $132,630 |
| 2017 | $3,153 | $152,630 | $20,000 | $132,630 |
| 2016 | $2,866 | $136,050 | $20,000 | $116,050 |
| 2015 | $1,315 | $136,050 | $20,000 | $116,050 |
| 2014 | $1,430 | $110,140 | $20,000 | $90,140 |
Source: Public Records
Map
Nearby Homes
- 153 Star Point Ln
- 199 Graystone Dr
- 2912 Fm 920
- 3400 Fm 920
- 105 N Ridge Ct
- Hillside Plan at Woodland Lakes Estates
- Haven Plan at Woodland Lakes Estates
- 1045 Woodland Rd
- 1049 Woodland Rd
- 1053 Woodland Rd
- 1037 Woodland Rd
- 2050 Woodland Rd
- 2055 Woodland Rd
- 2046 Woodland Rd
- 1025 Woodland Rd
- 1044 Woodland Rd
- 1057 Woodland Rd
- 2026 Woodland Rd
- 1029 Woodland Rd
- 2058 Woodland Rd
- 3030 Dusk Dr
- 3031 Dusk Dr
- 3039 Dusk Dr
- 3029 Dusk Dr
- 3040 Dusk Dr
- 3029 Sunrise Trail
- 3035 Sunrise Trail
- 3027 Dusk Dr
- 3039 Sunrise Trail
- 3045 Dusk Dr
- 3027 Sunrise Trail
- 3025 Dusk Dr
- 3025 Sunrise Trail
- 3036 Sunrise Trail
- 3032 Sunrise Trail
- 3046 Dusk Dr
- 3030 Sunrise Trail
- 3023 Dusk Dr
- 3040 Sunrise Trail
- 3028 Sunrise Trail