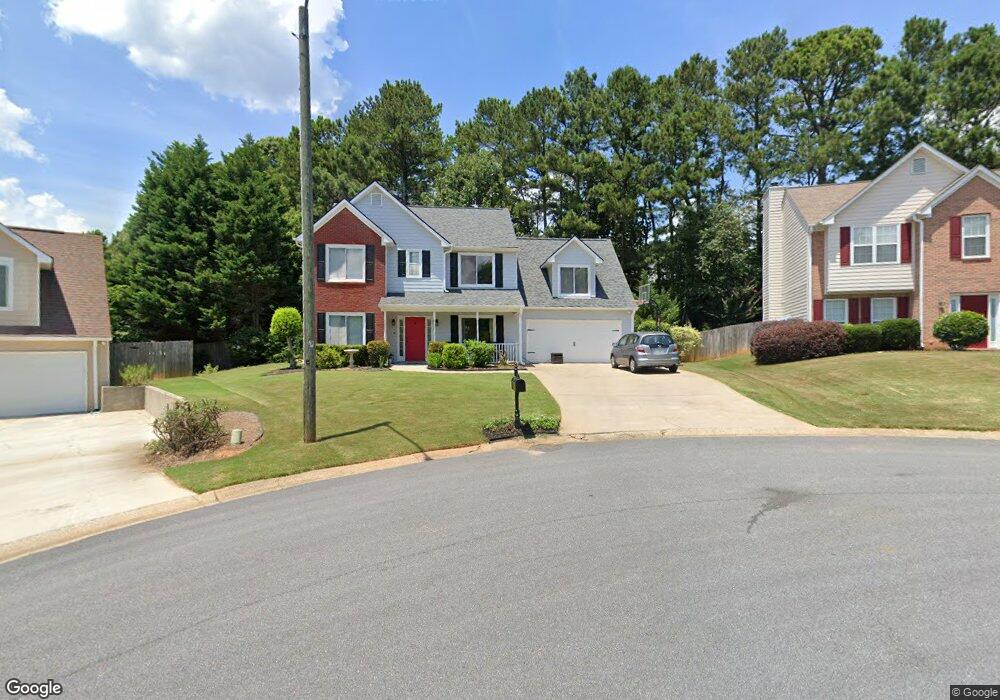
3034 Lexington Ave Unit 3 Woodstock, GA 30189
Oak Grove NeighborhoodEstimated Value: $447,221 - $448,000
4
Beds
3
Baths
2,024
Sq Ft
$221/Sq Ft
Est. Value
About This Home
This home is located at 3034 Lexington Ave Unit 3, Woodstock, GA 30189 and is currently estimated at $447,611, approximately $221 per square foot. 3034 Lexington Ave Unit 3 is a home located in Cherokee County with nearby schools including Carmel Elementary School, Woodstock Middle School, and Woodstock High School.
Ownership History
Date
Name
Owned For
Owner Type
Purchase Details
Closed on
Aug 15, 2002
Sold by
Hummel Gerard R and Hummel Eve
Bought by
Hummel Gerard R
Current Estimated Value
Home Financials for this Owner
Home Financials are based on the most recent Mortgage that was taken out on this home.
Original Mortgage
$132,000
Outstanding Balance
$55,616
Interest Rate
6.49%
Mortgage Type
New Conventional
Estimated Equity
$391,995
Purchase Details
Closed on
Feb 16, 2000
Sold by
Hummel Gerard R
Bought by
Hummel Gerard R and Hummel Eve
Home Financials for this Owner
Home Financials are based on the most recent Mortgage that was taken out on this home.
Original Mortgage
$25,000
Interest Rate
8.02%
Mortgage Type
New Conventional
Purchase Details
Closed on
Aug 23, 1996
Sold by
Ashlar Homes Ltd
Bought by
Hummel Gerard R Eve
Create a Home Valuation Report for This Property
The Home Valuation Report is an in-depth analysis detailing your home's value as well as a comparison with similar homes in the area
Home Values in the Area
Average Home Value in this Area
Purchase History
| Date | Buyer | Sale Price | Title Company |
|---|---|---|---|
| Hummel Gerard R | -- | -- | |
| Hummel Gerard R | -- | -- | |
| Hummel Gerard R | -- | -- | |
| Hummel Gerard R Eve | $129,000 | -- |
Source: Public Records
Mortgage History
| Date | Status | Borrower | Loan Amount |
|---|---|---|---|
| Open | Hummel Gerard R | $132,000 | |
| Previous Owner | Hummel Gerard R | $25,000 | |
| Closed | Hummel Gerard R Eve | $0 |
Source: Public Records
Tax History Compared to Growth
Tax History
| Year | Tax Paid | Tax Assessment Tax Assessment Total Assessment is a certain percentage of the fair market value that is determined by local assessors to be the total taxable value of land and additions on the property. | Land | Improvement |
|---|---|---|---|---|
| 2024 | $4,131 | $158,976 | $35,600 | $123,376 |
| 2023 | $3,919 | $150,824 | $32,000 | $118,824 |
| 2022 | $3,229 | $122,872 | $28,000 | $94,872 |
| 2021 | $2,795 | $98,440 | $22,880 | $75,560 |
| 2020 | $2,619 | $92,160 | $21,200 | $70,960 |
| 2019 | $2,420 | $85,160 | $19,200 | $65,960 |
| 2018 | $2,210 | $77,320 | $16,800 | $60,520 |
| 2017 | $2,185 | $189,600 | $16,800 | $59,040 |
| 2016 | $2,197 | $188,700 | $16,800 | $58,680 |
| 2015 | $2,017 | $171,500 | $14,400 | $54,200 |
| 2014 | $1,813 | $153,900 | $14,400 | $47,160 |
Source: Public Records
Map
Nearby Homes
- 1045 Legacy Walk
- 115 Township Ct
- 2018 Township Dr Unit 1
- 615 Lexington Way Unit IV
- 1015 Legacy Walk
- 4054 Mount Vernon Dr Unit 2
- 2004 Township Dr
- 525 Brooksdale Dr
- 201 Vista Ln
- 333 Etowah Valley Trace
- 510 Scenic Pass
- 705 Wind Song Trace
- 708 Wind Song Trace
- 802 Eagle Glen Crossing
- 353 Vista Ln
- 510 Terrace Way
- 117 Wood Wind Station
- 2173 Bascomb Carmel Rd
- 3036 Lexington Ave Unit 3
- 3032 Lexington Ave
- 4090 Mount Vernon Dr Unit 28
- 4090 Mount Vernon Dr Unit 3
- 2043 Township Dr
- 2041 Township Dr Unit 142
- 2041 Township Dr
- 2045 Township Dr
- 3038 Lexington Ave
- 4088 Mount Vernon Dr
- 4092 Mount Vernon Dr
- 2039 Township Dr
- 2047 Township Dr
- 3035 Lexington Ave Unit III
- 3033 Lexington Ave Unit 222
- 3033 Lexington Ave
- 3040 Lexington Ave
- 3028 Lexington Ave
- 4086 Mount Vernon Dr
- 2037 Township Dr Unit 1