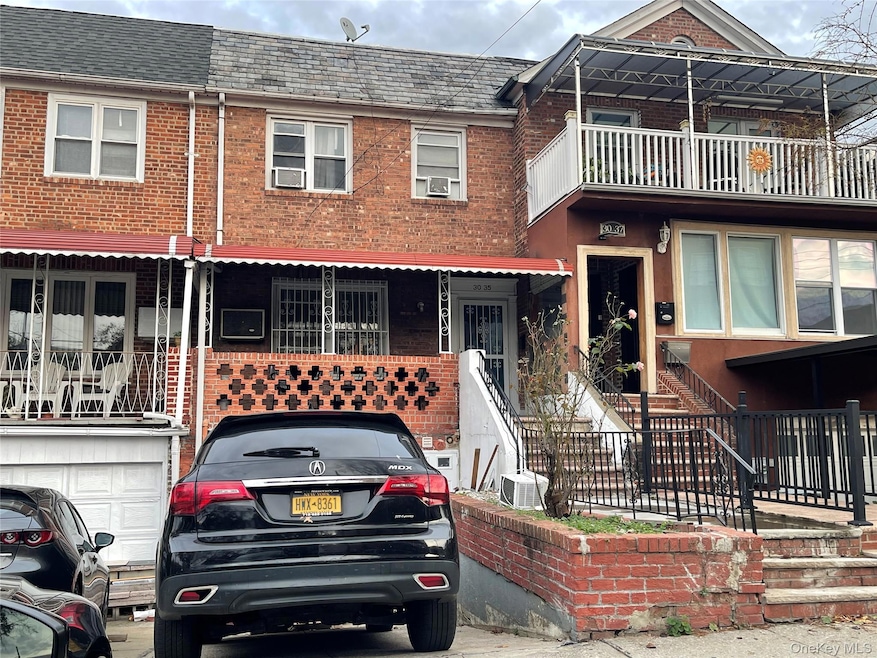
3035 82nd St East Elmhurst, NY 11370
Jackson Heights NeighborhoodEstimated payment $5,990/month
Highlights
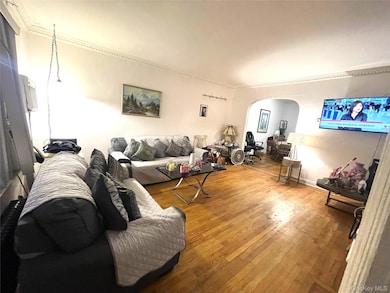
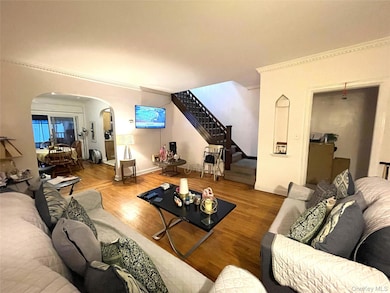
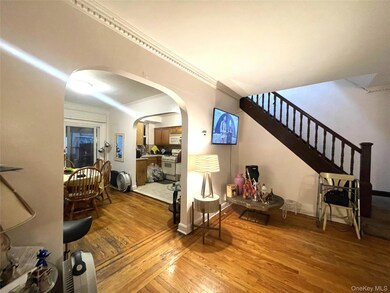
- Open Floorplan
- Colonial Architecture
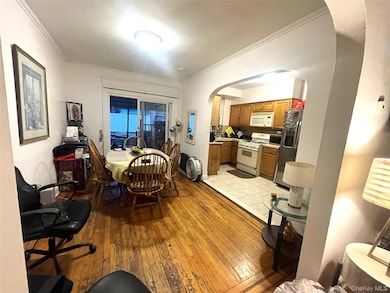
- Formal Dining Room
- P.S. 2 Alfred Zimberg Rated A-
- Wood Flooring
- 4-minute walk to Gorman Playground
About This Home
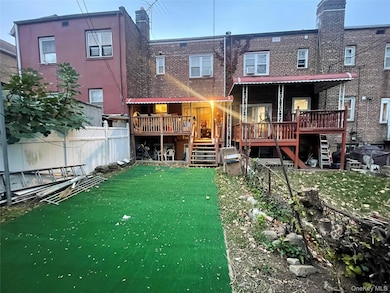
Welcome to this charming brick single-family home located in the heart of East Elmhurst! This beautifully maintained residence offers a spacious layout with bright living and dining areas, an open kitchen, and comfortable bedrooms. Enjoy a private backyard perfect for entertaining or relaxing outdoors. The home also features a full basement for additional storage or recreation space. Conveniently situated near shopping, restaurants, LaGuardia Airport, major highways, and public transportation. A wonderful opportunity to own a home in one of Queens’ most desirable neighborhoods!
Listing Agent
Keller Williams Landmark II Brokerage Phone: 347-846-1200 License #10301202369 Listed on: 11/11/2025

Open House Schedule
-
Saturday, November 15, 202512:00 to 2:00 pm11/15/2025 12:00:00 PM +00:0011/15/2025 2:00:00 PM +00:00Add to Calendar
Home Details
Home Type
- Single Family
Est. Annual Taxes
- $8,688
Year Built
- Built in 1935
Lot Details
- 1,800 Sq Ft Lot
- Lot Dimensions are 18x100
Home Design
- Colonial Architecture
- Brick Exterior Construction
Interior Spaces
- 1,890 Sq Ft Home
- Open Floorplan
- Entrance Foyer
- Formal Dining Room
- Wood Flooring
- Gas Range
Bedrooms and Bathrooms
- 3 Bedrooms
- 2 Full Bathrooms
Laundry
- Dryer
- Washer
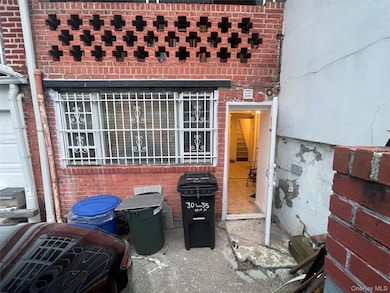
Finished Basement
- Walk-Out Basement
- Basement Fills Entire Space Under The House
- Laundry in Basement
Parking
- 1 Parking Space
- Driveway
Schools
- East Elmhurst Community Elementary School
- Is 227 Louis Armstrong Middle School
- William Cullen Bryant High School
Utilities
- Cooling System Mounted To A Wall/Window
- Heating System Uses Steam
- Heating System Uses Natural Gas
Listing and Financial Details
- Assessor Parcel Number 01380-0060
Map
Home Values in the Area
Average Home Value in this Area
Tax History
| Year | Tax Paid | Tax Assessment Tax Assessment Total Assessment is a certain percentage of the fair market value that is determined by local assessors to be the total taxable value of land and additions on the property. | Land | Improvement |
|---|---|---|---|---|
| 2025 | $8,196 | $43,255 | $7,223 | $36,032 |
| 2024 | $8,196 | $40,807 | $7,266 | $33,541 |
| 2023 | $7,836 | $39,014 | $5,965 | $33,049 |
| 2022 | $7,681 | $56,220 | $10,320 | $45,900 |
| 2021 | $7,550 | $54,840 | $10,320 | $44,520 |
| 2020 | $7,630 | $58,560 | $10,320 | $48,240 |
| 2019 | $7,114 | $50,160 | $10,320 | $39,840 |
| 2018 | $6,628 | $32,512 | $6,384 | $26,128 |
| 2017 | $6,425 | $31,518 | $7,477 | $24,041 |
| 2016 | $6,017 | $31,518 | $7,477 | $24,041 |
| 2015 | -- | $30,038 | $8,627 | $21,411 |
| 2014 | -- | $28,339 | $9,479 | $18,860 |
Property History
| Date | Event | Price | List to Sale | Price per Sq Ft |
|---|---|---|---|---|
| 11/11/2025 11/11/25 | For Sale | $999,000 | -- | $529 / Sq Ft |
Purchase History
| Date | Type | Sale Price | Title Company |
|---|---|---|---|
| Deed | -- | -- | |
| Deed | $205,000 | -- |
Mortgage History
| Date | Status | Loan Amount | Loan Type |
|---|---|---|---|
| Previous Owner | $184,500 | No Value Available |
Source: OneKey® MLS
MLS Number: 934091
APN: 01380-0060
Disclaimer: Certain information contained herein is derived from information provided by parties other than Homes.com. All information provided is deemed reliable, but is not guaranteed to be accurate and should be independently verified.
![]() The data relating to real estate for sale or lease on this web site comes in part from OneKey® MLS. Real estate listings held by brokerage firms other than Ten-X are marked with the OneKey® MLS logo or an abbreviated logo and detailed information about them includes the name of the listing broker.
The data relating to real estate for sale or lease on this web site comes in part from OneKey® MLS. Real estate listings held by brokerage firms other than Ten-X are marked with the OneKey® MLS logo or an abbreviated logo and detailed information about them includes the name of the listing broker.
IDX information is provided exclusively for personal, non-commercial use, and may not be used for any purpose other than to identify prospective properties consumers may be interested in purchasing.
Information is deemed reliable but not guaranteed.
Copyright 2025 OneKey® MLS. All rights reserved.
- 3116 84th St Unit 2
- 7911 32nd Ave
- 7911 32nd Ave
- 2530 78th St
- 25-40 77th St Unit 1
- 3103 88th St
- 8105 Northern Blvd
- 24-12 86th St Unit 2
- 3003 73rd St Unit 2nd Floor
- 2649 91st St Unit Basement apartment
- 25-52 73rd St Unit 1
- 76-10 34th Ave Unit 3T
- 2438 93rd St Unit 2
- 3404 76th St Unit 3
- 75-03 Astoria Blvd N Unit 3
- 2141 78th St Unit 1
- 33-25 Junction Blvd Unit 4-A
- 35-64 85th St Unit 4-D
- 34-42 71st St Unit 3rd Floor
- 35-20 93rd St