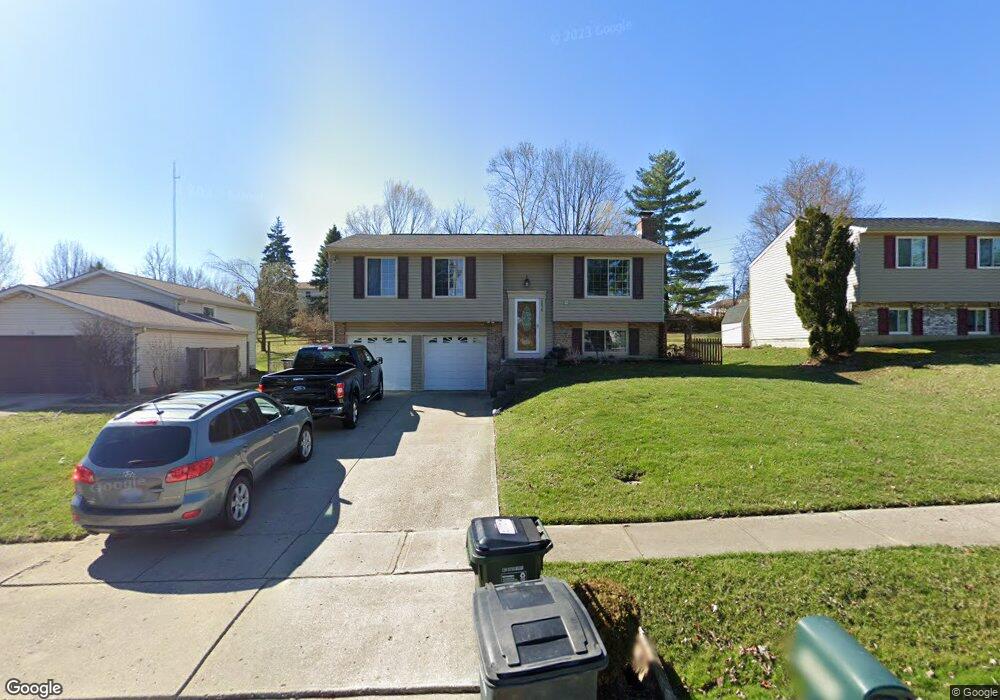
3035 John Gray Rd Cincinnati, OH 45251
Estimated Value: $240,802 - $267,000
3
Beds
2
Baths
1,484
Sq Ft
$171/Sq Ft
Est. Value
About This Home
This home is located at 3035 John Gray Rd, Cincinnati, OH 45251 and is currently estimated at $254,451, approximately $171 per square foot. 3035 John Gray Rd is a home located in Hamilton County with nearby schools including Pleasant Run Elementary School, Pleasant Run Middle School, and Northwest High School.
Ownership History
Date
Name
Owned For
Owner Type
Purchase Details
Closed on
May 26, 2022
Sold by
Bradley Denise L and Bradley Anthony
Bought by
Bradley Denise L and Green Anthony
Current Estimated Value
Purchase Details
Closed on
May 2, 2000
Sold by
Larason Barbara J
Bought by
Bradley Denise L
Home Financials for this Owner
Home Financials are based on the most recent Mortgage that was taken out on this home.
Original Mortgage
$114,841
Interest Rate
8.26%
Mortgage Type
FHA
Purchase Details
Closed on
Apr 26, 2000
Sold by
Larason Gary G
Bought by
Larason Barbara C
Home Financials for this Owner
Home Financials are based on the most recent Mortgage that was taken out on this home.
Original Mortgage
$114,841
Interest Rate
8.26%
Mortgage Type
FHA
Purchase Details
Closed on
Apr 17, 2000
Sold by
Larason Gary G
Bought by
Larason Barbara J
Home Financials for this Owner
Home Financials are based on the most recent Mortgage that was taken out on this home.
Original Mortgage
$114,841
Interest Rate
8.26%
Mortgage Type
FHA
Create a Home Valuation Report for This Property
The Home Valuation Report is an in-depth analysis detailing your home's value as well as a comparison with similar homes in the area
Home Values in the Area
Average Home Value in this Area
Purchase History
| Date | Buyer | Sale Price | Title Company |
|---|---|---|---|
| Bradley Denise L | $250 | Milikin & Fitton Law Firm | |
| Bradley Denise L | $114,900 | -- | |
| Larason Barbara C | -- | -- | |
| Larason Barbara J | -- | -- |
Source: Public Records
Mortgage History
| Date | Status | Borrower | Loan Amount |
|---|---|---|---|
| Previous Owner | Bradley Denise L | $114,841 |
Source: Public Records
Tax History
| Year | Tax Paid | Tax Assessment Tax Assessment Total Assessment is a certain percentage of the fair market value that is determined by local assessors to be the total taxable value of land and additions on the property. | Land | Improvement |
|---|---|---|---|---|
| 2025 | $3,661 | $63,473 | $11,270 | $52,203 |
| 2024 | $3,394 | $63,473 | $11,270 | $52,203 |
| 2023 | $3,414 | $63,473 | $11,270 | $52,203 |
| 2022 | $3,075 | $46,610 | $9,265 | $37,345 |
| 2021 | $3,048 | $46,610 | $9,265 | $37,345 |
| 2020 | $3,081 | $46,610 | $9,265 | $37,345 |
| 2019 | $2,663 | $37,591 | $7,473 | $30,118 |
| 2018 | $2,389 | $37,591 | $7,473 | $30,118 |
| 2017 | $2,264 | $37,591 | $7,473 | $30,118 |
| 2016 | $2,124 | $34,787 | $9,310 | $25,477 |
| 2015 | $2,144 | $34,787 | $9,310 | $25,477 |
| 2014 | $2,148 | $34,787 | $9,310 | $25,477 |
| 2013 | $2,151 | $36,617 | $9,800 | $26,817 |
Source: Public Records
Map
Nearby Homes
- 12161 Birchgrove Ct
- 6375 Jamesfield Ct
- 11992 Pippin Rd
- 12158 Westerly Dr
- 11911 Pippin Rd
- 2537 Haverknoll Dr
- 11995 Wincanton Dr
- 3330 Celedon Ct
- 1301 Parkway Ct
- 1560 Gelhot Dr
- 1535 Gelhot Dr
- 1570 Gelhot Dr
- 6077 Gray Rd
- 1594 Gelhot Dr
- 121 Elk Ct
- 1610 Gelhot Dr
- 12080 Regency Run Ct Unit 4
- 1545 Parliament Ct
- 5826 High Point Ct
- 2465 Owlcrest Dr
- 3021 John Gray Rd
- 3047 John Gray Rd
- 3007 John Gray Rd
- 3061 John Gray Rd
- 12175 Glencrest Ct
- 2993 John Gray Rd
- 3075 John Gray Rd
- 60 Apothecary Place
- 3030 Spruceway Dr
- 3040 Spruceway Dr
- 12159 Glencrest Ct
- 12183 Glencrest Ct
- 50 Apothecary Place
- 6391 Kings Arms Way
- 2981 John Gray Rd
- 3087 John Gray Rd
- 12151 Glencrest Ct
- 12174 Glencrest Ct
- 55 Apothecary Place
- 3048 Spruceway Dr
Your Personal Tour Guide
Ask me questions while you tour the home.