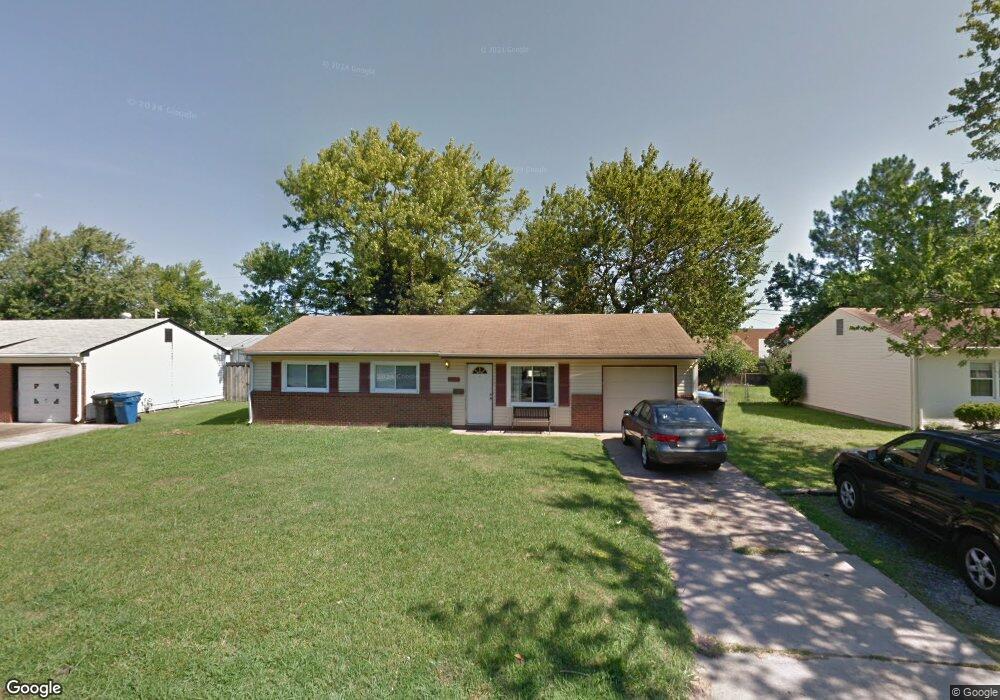
3036 Bowling Green Dr Virginia Beach, VA 23452
Bow Creek NeighborhoodEstimated Value: $321,000 - $343,000
3
Beds
2
Baths
1,014
Sq Ft
$328/Sq Ft
Est. Value
About This Home
This home is located at 3036 Bowling Green Dr, Virginia Beach, VA 23452 and is currently estimated at $332,356, approximately $327 per square foot. 3036 Bowling Green Dr is a home located in Virginia Beach City with nearby schools including Brookwood Elementary School, Corporate Landing Middle School, and Ocean Lakes High School.
Ownership History
Date
Name
Owned For
Owner Type
Purchase Details
Closed on
Nov 18, 2022
Sold by
Zajda Michael Richard
Bought by
Boeck Jasmine Marie
Current Estimated Value
Home Financials for this Owner
Home Financials are based on the most recent Mortgage that was taken out on this home.
Original Mortgage
$283,765
Outstanding Balance
$274,966
Interest Rate
6.95%
Mortgage Type
FHA
Estimated Equity
$57,390
Purchase Details
Closed on
Mar 14, 2019
Sold by
Cedar Homes Investments Llc
Bought by
Zajda Richard
Home Financials for this Owner
Home Financials are based on the most recent Mortgage that was taken out on this home.
Original Mortgage
$177,187
Interest Rate
4.4%
Mortgage Type
VA
Purchase Details
Closed on
Oct 15, 2018
Sold by
Lakeview Loan Servicing Llc
Bought by
Cedar Homes Investments Llc
Purchase Details
Closed on
Aug 9, 2018
Sold by
Terra Abstract Virginia Inc
Bought by
Lakeview Loan Servincing Llc
Create a Home Valuation Report for This Property
The Home Valuation Report is an in-depth analysis detailing your home's value as well as a comparison with similar homes in the area
Home Values in the Area
Average Home Value in this Area
Purchase History
| Date | Buyer | Sale Price | Title Company |
|---|---|---|---|
| Boeck Jasmine Marie | $289,000 | Priority Title & Escrow | |
| Zajda Richard | $215,000 | Titlequest Of Hampton Roads | |
| Cedar Homes Investments Llc | $140,600 | Bay National Title Co | |
| Lakeview Loan Servincing Llc | $149,850 | None Available |
Source: Public Records
Mortgage History
| Date | Status | Borrower | Loan Amount |
|---|---|---|---|
| Open | Boeck Jasmine Marie | $283,765 | |
| Previous Owner | Zajda Richard | $177,187 |
Source: Public Records
Tax History Compared to Growth
Tax History
| Year | Tax Paid | Tax Assessment Tax Assessment Total Assessment is a certain percentage of the fair market value that is determined by local assessors to be the total taxable value of land and additions on the property. | Land | Improvement |
|---|---|---|---|---|
| 2025 | $2,592 | $273,400 | $129,000 | $144,400 |
| 2024 | $2,592 | $267,200 | $115,000 | $152,200 |
| 2023 | $2,553 | $257,900 | $111,000 | $146,900 |
| 2022 | $2,388 | $241,200 | $111,000 | $130,200 |
| 2021 | $2,018 | $203,800 | $88,000 | $115,800 |
| 2020 | $2,024 | $198,900 | $80,000 | $118,900 |
| 2019 | $1,672 | $157,600 | $80,000 | $77,600 |
| 2018 | $1,580 | $157,600 | $80,000 | $77,600 |
| 2017 | $1,505 | $150,100 | $72,500 | $77,600 |
| 2016 | $1,486 | $150,100 | $72,500 | $77,600 |
| 2015 | $1,522 | $153,700 | $78,800 | $74,900 |
| 2014 | $1,442 | $146,400 | $84,000 | $62,400 |
Source: Public Records
Map
Nearby Homes
- 725 Burgesses Ln
- 701 S Lynnhaven Rd
- 3117 Coach House Ln
- 733 Lamplight Ln
- 3073 Pewter Rd
- 3217 Deer Park Dr
- 3256 Deer Park Dr
- 3016 Cobblestone Dr
- 816 Holly Hedge Ave
- 720 Fox Run Rd
- 301 Bethune Dr
- 2955 Talon Ct
- 1012 Blue Spring Ln
- 3401 Woodsman Ln
- 996 Lynnhaven Pkwy
- 3152 Ashaway Rd
- 3063 Breslaw Ct
- 662 Rivers Reach
- 502 Pheasant Run
- 635 Rivers Reach
- 3032 Bowling Green Dr
- 3040 Bowling Green Dr
- 3037 Ferry Farm Ln
- 3033 Ferry Farm Ln
- 3041 Ferry Farm Ln
- 3037 Bowling Green Dr
- 3028 Bowling Green Dr
- 3100 Bowling Green Dr
- 3029 Ferry Farm Ln
- 3033 Bowling Green Dr
- 3101 Bowling Green Dr
- 3101 Ferry Farm Ln
- 3025 Ferry Farm Ln
- 3024 Bowling Green Dr
- 3029 Bowling Green Dr
- 3104 Bowling Green Dr
- 704 Burgesses Ln
- 705 Burgesses Ln
- 3105 Ferry Farm Ln
- 3105 Bowling Green Dr