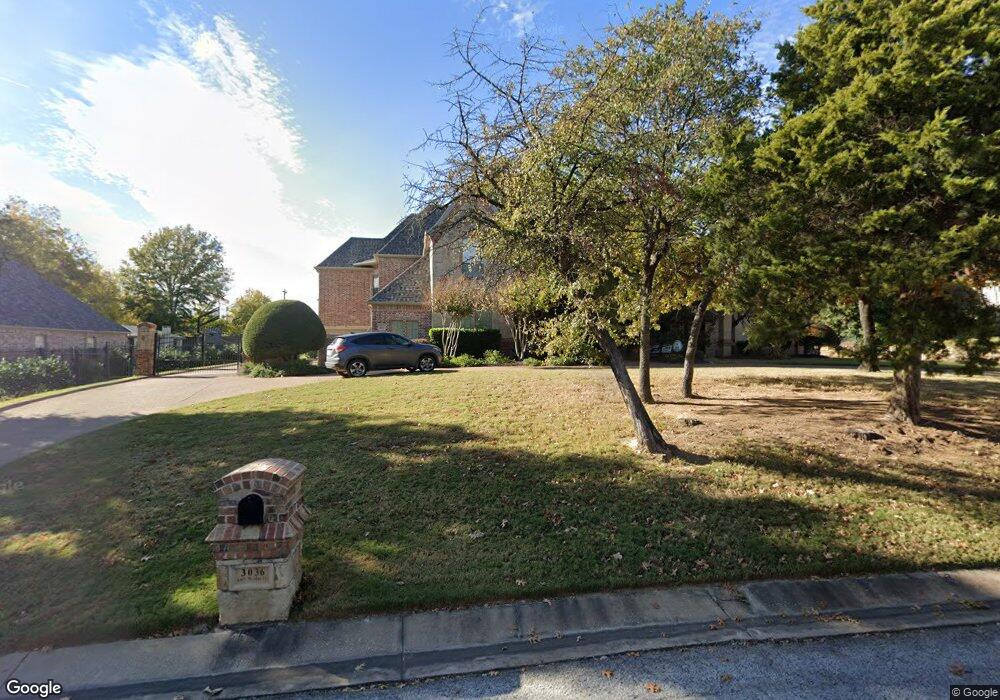
3036 Loch Meadow Ct Southlake, TX 76092
Estimated Value: $2,292,000 - $2,366,000
5
Beds
5
Baths
5,831
Sq Ft
$400/Sq Ft
Est. Value
About This Home
This home is located at 3036 Loch Meadow Ct, Southlake, TX 76092 and is currently estimated at $2,331,419, approximately $399 per square foot. 3036 Loch Meadow Ct is a home located in Tarrant County with nearby schools including Walnut Grove Elementary School, Don T. Durham Intermediate School, and Carroll Middle School.
Ownership History
Date
Name
Owned For
Owner Type
Purchase Details
Closed on
May 1, 2013
Sold by
Shipowitz Jay B and Shipowitz Daphne
Bought by
Hubbard Darrin M
Current Estimated Value
Home Financials for this Owner
Home Financials are based on the most recent Mortgage that was taken out on this home.
Original Mortgage
$676,000
Outstanding Balance
$481,164
Interest Rate
3.58%
Mortgage Type
New Conventional
Estimated Equity
$1,850,255
Purchase Details
Closed on
Apr 25, 2003
Sold by
Loch Development Ltd
Bought by
Shipowitz Jay B and Shipowitz Daphne
Home Financials for this Owner
Home Financials are based on the most recent Mortgage that was taken out on this home.
Original Mortgage
$645,000
Interest Rate
5.8%
Mortgage Type
Purchase Money Mortgage
Create a Home Valuation Report for This Property
The Home Valuation Report is an in-depth analysis detailing your home's value as well as a comparison with similar homes in the area
Home Values in the Area
Average Home Value in this Area
Purchase History
| Date | Buyer | Sale Price | Title Company |
|---|---|---|---|
| Hubbard Darrin M | -- | None Available | |
| Shipowitz Jay B | -- | Commonwealth Land Title |
Source: Public Records
Mortgage History
| Date | Status | Borrower | Loan Amount |
|---|---|---|---|
| Open | Hubbard Darrin M | $676,000 | |
| Previous Owner | Shipowitz Jay B | $645,000 | |
| Closed | Shipowitz Jay B | $129,000 |
Source: Public Records
Tax History Compared to Growth
Tax History
| Year | Tax Paid | Tax Assessment Tax Assessment Total Assessment is a certain percentage of the fair market value that is determined by local assessors to be the total taxable value of land and additions on the property. | Land | Improvement |
|---|---|---|---|---|
| 2025 | $23,829 | $1,976,895 | $525,030 | $1,451,865 |
| 2024 | $23,829 | $1,976,895 | $525,030 | $1,451,865 |
| 2023 | $25,468 | $1,983,496 | $525,030 | $1,458,466 |
| 2022 | $27,405 | $1,458,184 | $375,025 | $1,083,159 |
| 2021 | $26,329 | $1,154,797 | $375,025 | $779,772 |
| 2020 | $27,583 | $1,200,000 | $450,020 | $749,980 |
| 2019 | $29,593 | $1,236,786 | $450,020 | $786,766 |
| 2018 | $25,565 | $1,111,000 | $450,020 | $660,980 |
| 2017 | $26,794 | $1,096,455 | $250,020 | $846,435 |
| 2016 | $24,358 | $1,105,393 | $250,025 | $855,368 |
| 2015 | $21,743 | $893,400 | $120,000 | $773,400 |
| 2014 | $21,743 | $893,400 | $120,000 | $773,400 |
Source: Public Records
Map
Nearby Homes
- 3179 Southlake Park Rd
- 3240 Woodland Dr
- 3333 Southlake Park Rd
- 2920 Burney Ln
- 1006 Quail Run Rd
- 1018 Quail Run Rd
- 136 Sweet St
- 415 Marshall Rd
- 1099 Burney Ln
- 517 Round Hollow Ln
- 1340 Burney Ln
- 2803 Tyler St
- 5 W Dove Rd
- 2112 Beaver Creek Ln
- 200 Murphy Dr
- 1013 Winfield Ct
- 112 Murphy Dr
- 424 Saint Tropez Dr
- 212 Saint Tropez Dr
- 2009 Wheeler Dr
- 3040 Loch Meadow Ct
- 3032 Loch Meadow Ct
- 3097 Ridgecrest Dr
- 3037 Loch Meadow Ct
- 3077 Ridgecrest Dr
- 3033 Loch Meadow Ct
- 3044 Loch Meadow Ct
- 3028 Loch Meadow Ct
- 3041 Loch Meadow Ct
- 3029 Loch Meadow Ct
- 3007 Ridgecrest Dr
- 3045 Loch Meadow Ct
- 3139 Southlake Park Rd
- 3139 Southlake Park Add Rd
- 3024 Loch Meadow Ct
- 3048 Loch Meadow Ct
- 3025 Loch Meadow Ct
- 3108 Southlake Park Rd
- 3049 Loch Meadow Ct
- 3108 Southlake Park Dr