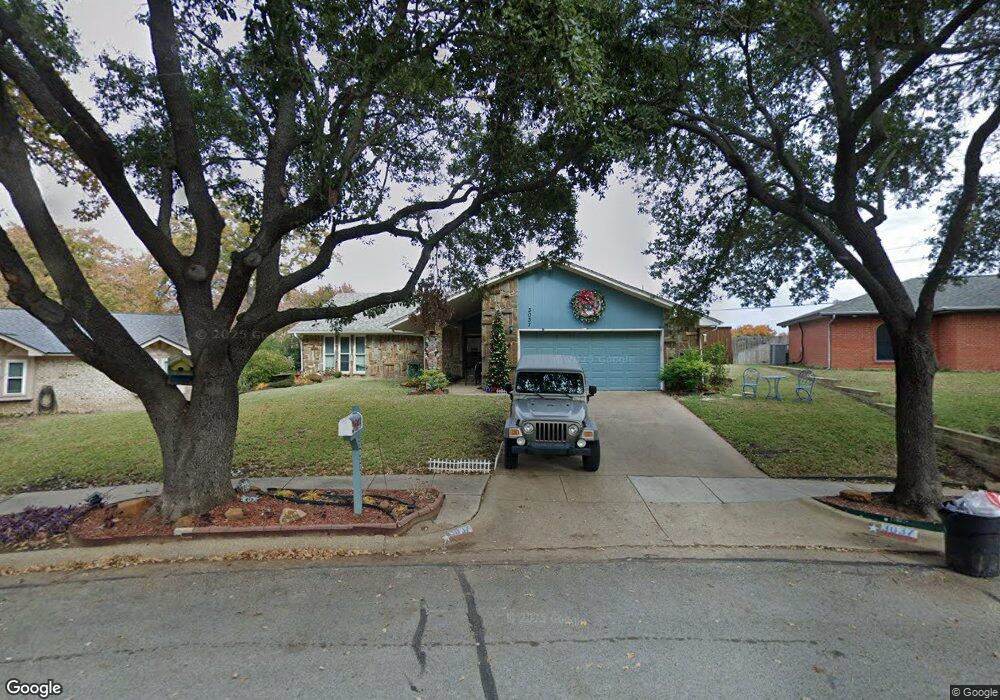
3037 Pin Oak Ln Bedford, TX 76021
Estimated Value: $340,926 - $403,000
3
Beds
2
Baths
1,851
Sq Ft
$202/Sq Ft
Est. Value
About This Home
This home is located at 3037 Pin Oak Ln, Bedford, TX 76021 and is currently estimated at $373,732, approximately $201 per square foot. 3037 Pin Oak Ln is a home located in Tarrant County with nearby schools including Meadow Creek Elementary School, Harwood Junior High School, and Trinity High School.
Ownership History
Date
Name
Owned For
Owner Type
Purchase Details
Closed on
Mar 14, 2018
Sold by
Jordan Jeannette
Bought by
Galindo Jacqueline Ann
Current Estimated Value
Purchase Details
Closed on
Jul 18, 2011
Sold by
Harrison Kenna R
Bought by
Jordan Jeannette
Home Financials for this Owner
Home Financials are based on the most recent Mortgage that was taken out on this home.
Original Mortgage
$141,324
Interest Rate
4.75%
Mortgage Type
FHA
Purchase Details
Closed on
Oct 11, 2001
Sold by
Lostocco A R
Bought by
Harrison Kenna R
Home Financials for this Owner
Home Financials are based on the most recent Mortgage that was taken out on this home.
Original Mortgage
$137,750
Interest Rate
6.85%
Purchase Details
Closed on
Nov 9, 1999
Sold by
Lostocco Anthony R and Lostocco Dale L
Bought by
Lostocco A R and Lostocco Dale
Create a Home Valuation Report for This Property
The Home Valuation Report is an in-depth analysis detailing your home's value as well as a comparison with similar homes in the area
Home Values in the Area
Average Home Value in this Area
Purchase History
| Date | Buyer | Sale Price | Title Company |
|---|---|---|---|
| Galindo Jacqueline Ann | -- | None Available | |
| Jordan Jeannette | -- | None Available | |
| Harrison Kenna R | -- | Alamo Title Company | |
| Lostocco A R | -- | -- |
Source: Public Records
Mortgage History
| Date | Status | Borrower | Loan Amount |
|---|---|---|---|
| Previous Owner | Jordan Jeannette | $141,324 | |
| Previous Owner | Harrison Kenna R | $137,750 |
Source: Public Records
Tax History Compared to Growth
Tax History
| Year | Tax Paid | Tax Assessment Tax Assessment Total Assessment is a certain percentage of the fair market value that is determined by local assessors to be the total taxable value of land and additions on the property. | Land | Improvement |
|---|---|---|---|---|
| 2025 | $5,636 | $220,420 | $75,000 | $145,420 |
| 2024 | $5,636 | $355,516 | $75,000 | $280,516 |
| 2023 | $6,383 | $383,511 | $45,000 | $338,511 |
| 2022 | $6,607 | $302,519 | $45,000 | $257,519 |
| 2021 | $6,646 | $296,030 | $45,000 | $251,030 |
| 2020 | $6,099 | $256,505 | $45,000 | $211,505 |
| 2019 | $5,736 | $256,505 | $45,000 | $211,505 |
| 2018 | $5,215 | $214,655 | $45,000 | $169,655 |
| 2017 | $6,007 | $248,323 | $30,000 | $218,323 |
| 2016 | $4,958 | $204,948 | $30,000 | $174,948 |
| 2015 | $4,347 | $173,100 | $22,000 | $151,100 |
| 2014 | $4,347 | $173,100 | $22,000 | $151,100 |
Source: Public Records
Map
Nearby Homes
- 3112 Hazlewood Ct
- 3024 Pecan Cir
- 3013 Bent Tree Ln
- 4001 Fairmont Ct
- 3405 Scenic Hills Dr
- 3001 Glenwood Ct
- 3017 Bluebonnet Ln
- 3932 Cedar Ridge Dr
- 3917 Autumn Ln
- 3409 Crescent Ct
- 3428 Pembroke Place
- 3409 Langley Hill Ln
- 3909 Allendale St
- 3713 Teal Ln
- 3209 Misty Ct
- 3213 Vintage Way
- 3816 Rolling Meadows Dr
- 3205 Princess St
- 3516 Lejoie Ln
- 3901 Campania Ct
- 3424 Pin Oak Ln
- 3033 Pin Oak Ln
- 3032 Scenic Hills Ct
- 3029 Pin Oak Ln
- 3420 Pin Oak Ln
- 3024 Scenic Hills Ct
- 3421 Pin Oak Ln
- 3034 Scenic Hills Ct
- 3025 Pin Oak Ln
- 3416 Pin Oak Ln
- 3504 Martin Dr
- 3020 Scenic Hills Ct
- 3417 Pin Oak Ln
- 3412 Willow Ln
- 3332 Manchester Cir
- 3041 Scenic Hills Ct
- 3037 Scenic Hills Ct
- 3536 Martin Dr
- 3408 Willow Ln
- 3412 Pin Oak Ln