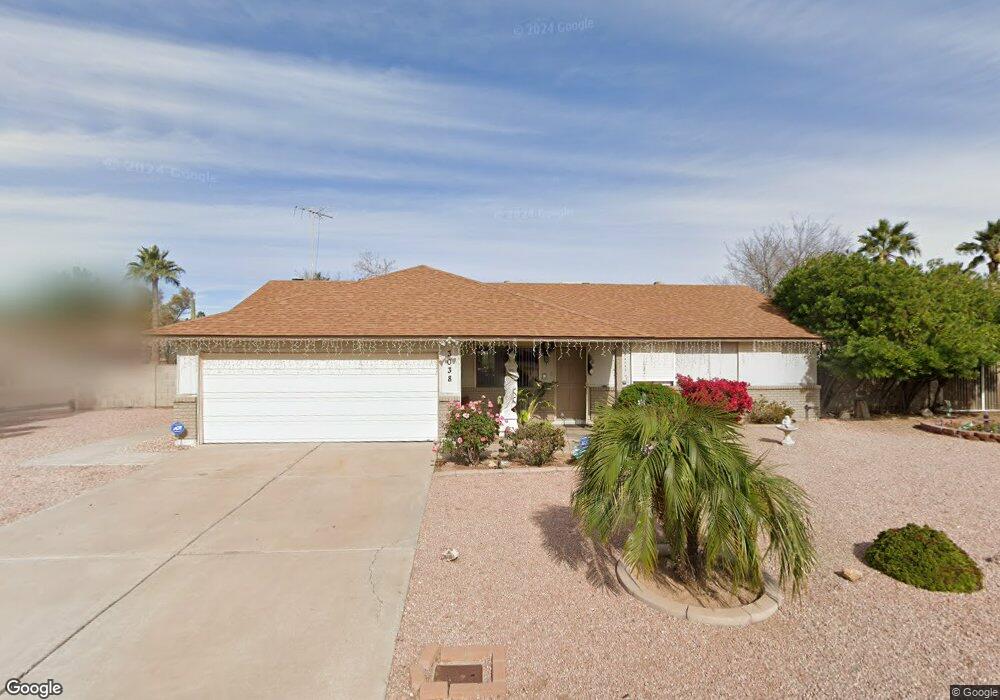
3038 E Decatur St Mesa, AZ 85213
The Groves NeighborhoodEstimated Value: $435,535 - $461,000
3
Beds
2
Baths
1,624
Sq Ft
$276/Sq Ft
Est. Value
About This Home
This home is located at 3038 E Decatur St, Mesa, AZ 85213 and is currently estimated at $448,884, approximately $276 per square foot. 3038 E Decatur St is a home located in Maricopa County with nearby schools including Highland Elementary School, Franklin at Brimhall Elementary School, and Franklin West Elementary School.
Ownership History
Date
Name
Owned For
Owner Type
Purchase Details
Closed on
Feb 4, 2026
Sold by
Shifflett Constantine B
Bought by
Connie Shifflett Living Trust and Shifflett
Current Estimated Value
Purchase Details
Closed on
Mar 25, 2010
Sold by
Brown Christopher M
Bought by
Shifflett Constantine B
Home Financials for this Owner
Home Financials are based on the most recent Mortgage that was taken out on this home.
Original Mortgage
$127,645
Interest Rate
5.5%
Mortgage Type
FHA
Purchase Details
Closed on
Jun 22, 2009
Sold by
Martin Joyce J Hohenstein and Schlinglof Tiffany Lynn
Bought by
Brown Christopher M
Home Financials for this Owner
Home Financials are based on the most recent Mortgage that was taken out on this home.
Original Mortgage
$61,500
Interest Rate
4.83%
Mortgage Type
New Conventional
Purchase Details
Closed on
Apr 7, 2004
Sold by
Hohenstein Jennie A
Bought by
Hohenstein Jennie A and Martin Joyce J Hohenstein
Purchase Details
Closed on
Sep 15, 2003
Sold by
Davis William Merle and Davis Roberta Lee
Bought by
Hohenstein Jennie
Create a Home Valuation Report for This Property
The Home Valuation Report is an in-depth analysis detailing your home's value as well as a comparison with similar homes in the area
Home Values in the Area
Average Home Value in this Area
Purchase History
| Date | Buyer | Sale Price | Title Company |
|---|---|---|---|
| Connie Shifflett Living Trust | -- | None Listed On Document | |
| Shifflett Constantine B | $130,000 | Great American Title Agency | |
| Brown Christopher M | $84,400 | Great American Title Agency | |
| Hohenstein Jennie A | -- | -- | |
| Hohenstein Jennie | $146,900 | Fidelity National Title |
Source: Public Records
Mortgage History
| Date | Status | Borrower | Loan Amount |
|---|---|---|---|
| Previous Owner | Shifflett Constantine B | $127,645 | |
| Previous Owner | Brown Christopher M | $61,500 |
Source: Public Records
Tax History
| Year | Tax Paid | Tax Assessment Tax Assessment Total Assessment is a certain percentage of the fair market value that is determined by local assessors to be the total taxable value of land and additions on the property. | Land | Improvement |
|---|---|---|---|---|
| 2025 | $1,051 | $17,403 | -- | -- |
| 2024 | $1,461 | $16,574 | -- | -- |
| 2023 | $1,461 | $32,050 | $6,410 | $25,640 |
| 2022 | $1,429 | $23,400 | $4,680 | $18,720 |
| 2021 | $1,468 | $22,600 | $4,520 | $18,080 |
| 2020 | $1,449 | $20,970 | $4,190 | $16,780 |
| 2019 | $1,342 | $18,280 | $3,650 | $14,630 |
| 2018 | $1,281 | $18,680 | $3,730 | $14,950 |
| 2017 | $1,241 | $15,860 | $3,170 | $12,690 |
| 2016 | $1,219 | $15,220 | $3,040 | $12,180 |
| 2015 | $1,150 | $14,430 | $2,880 | $11,550 |
Source: Public Records
Map
Nearby Homes
- 3228 E Dover St
- 3050 E Cicero St
- 3203 E Ellis St
- 3160 E Enrose St
- 3020 E Main St Unit G97
- 3020 E Main St Unit I-52
- 3020 E Main St Unit T82
- 824 N York Cir
- 3345 E University Dr Unit 42
- 3345 E University Dr Unit 32
- 3345 E University Dr Unit 39
- 3345 E University Dr Unit 28
- 3345 E University Dr Unit 72
- 1111 N Alba Cir
- 303 N Lindsay Rd Unit O-8
- 303 N Lindsay Rd Unit W-13
- 303 N Lindsay Rd Unit I95
- 303 N Lindsay Rd Unit I-102
- 303 N Lindsay Rd Unit W-4
- 303 N Lindsay Rd Unit W15
- 3046 E Decatur St
- 3039 E Dover St
- 3030 E Decatur St
- 3047 E Dover St
- 614 N Los Alamos
- 3106 E Decatur St
- 626 N Los Alamos
- 3022 E Decatur St
- 3109 E Dover St
- 3020 E Decatur St
- 3114 E Decatur St
- 625 N Rico Cir
- 3035 E Dover St
- 618 N Rico Cir
- 3117 E Dover St
- 3019 E Dover St
- 3014 E Decatur St
- 3108 E Dover St
- 3122 E Decatur St
- 3131 E Covina St
Your Personal Tour Guide
Ask me questions while you tour the home.