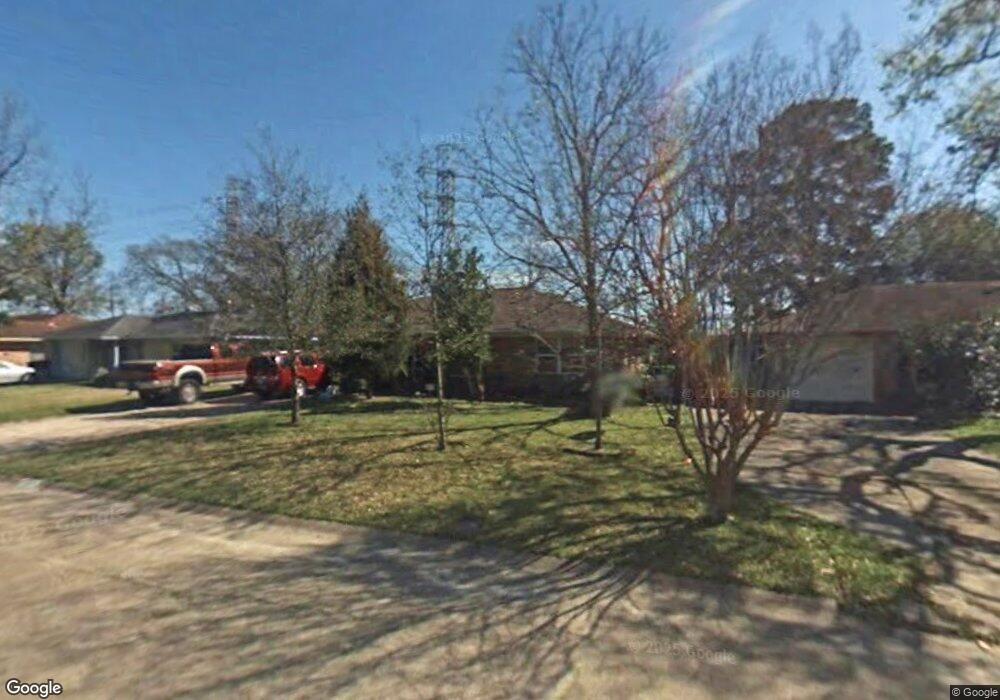
3038 Oak Forest Dr Houston, TX 77018
Oak Forest-Garden Oaks NeighborhoodEstimated Value: $374,000 - $421,087
3
Beds
2
Baths
1,345
Sq Ft
$290/Sq Ft
Est. Value
About This Home
This home is located at 3038 Oak Forest Dr, Houston, TX 77018 and is currently estimated at $389,522, approximately $289 per square foot. 3038 Oak Forest Dr is a home located in Harris County with nearby schools including Oak Forest Elementary School, Frank Black Middle School, and Waltrip High School.
Ownership History
Date
Name
Owned For
Owner Type
Purchase Details
Closed on
Jun 20, 2016
Sold by
Casillo Carmen Franco
Bought by
Ortega Cleofas Rios
Current Estimated Value
Home Financials for this Owner
Home Financials are based on the most recent Mortgage that was taken out on this home.
Original Mortgage
$50,440
Interest Rate
3.46%
Mortgage Type
New Conventional
Purchase Details
Closed on
Sep 29, 1997
Sold by
Irby Carol Sue and Mcmullin Harold Wayne
Bought by
Rios Cleofas O and Castillo Carmen
Home Financials for this Owner
Home Financials are based on the most recent Mortgage that was taken out on this home.
Original Mortgage
$50,440
Interest Rate
7.49%
Purchase Details
Closed on
Nov 29, 1995
Sold by
Hud
Bought by
Mcmullin Harold Wayne
Purchase Details
Closed on
Dec 6, 1994
Sold by
Acevedo William G
Bought by
Hud
Create a Home Valuation Report for This Property
The Home Valuation Report is an in-depth analysis detailing your home's value as well as a comparison with similar homes in the area
Home Values in the Area
Average Home Value in this Area
Purchase History
| Date | Buyer | Sale Price | Title Company |
|---|---|---|---|
| Ortega Cleofas Rios | -- | None Available | |
| Rios Cleofas O | -- | Commonwealth Land Title Co | |
| Mcmullin Harold Wayne | -- | -- | |
| Hud | -- | -- |
Source: Public Records
Mortgage History
| Date | Status | Borrower | Loan Amount |
|---|---|---|---|
| Previous Owner | Ortega Cleofas Rios | $50,440 | |
| Previous Owner | Rios Cleofas O | $50,440 |
Source: Public Records
Tax History Compared to Growth
Tax History
| Year | Tax Paid | Tax Assessment Tax Assessment Total Assessment is a certain percentage of the fair market value that is determined by local assessors to be the total taxable value of land and additions on the property. | Land | Improvement |
|---|---|---|---|---|
| 2025 | $5,787 | $358,365 | $240,320 | $118,045 |
| 2024 | $5,787 | $405,101 | $300,400 | $104,701 |
| 2023 | $5,787 | $370,176 | $262,850 | $107,326 |
| 2022 | $7,223 | $336,581 | $225,300 | $111,281 |
| 2021 | $6,950 | $298,207 | $187,750 | $110,457 |
| 2020 | $7,221 | $298,207 | $187,750 | $110,457 |
| 2019 | $7,456 | $294,652 | $187,750 | $106,902 |
| 2018 | $5,831 | $301,454 | $150,200 | $151,254 |
| 2017 | $7,622 | $301,454 | $150,200 | $151,254 |
| 2016 | $6,044 | $301,454 | $150,200 | $151,254 |
| 2015 | $3,904 | $288,399 | $150,200 | $138,199 |
| 2014 | $3,904 | $233,977 | $112,650 | $121,327 |
Source: Public Records
Map
Nearby Homes
- 3042 Oak Forest Dr
- 2203 Bron Holly Dr
- 1919 Ansbury Dr
- 2215 Ansbury Dr
- 1726 Ansbury Dr
- 2006 Lou Ellen Ln Unit H
- 3506 Oak Forest Dr
- 2402 Bron Holly Dr
- 2323 Wilde Rock Way
- 2206 Lou Ellen Ln Unit C
- 2411 Stonecrest Dr
- 2116 Oatfield Dr
- 2210 Lou Ellen Ln Unit F
- 2122 Oatfield Dr
- 2403 Ansbury Dr
- 1635 Wilde Rock Way
- 3508 Piney Woods Dr
- 3516 Piney Woods Dr
- 3520 Piney Woods Dr
- 1339 Du Barry Ln
- 3034 Oak Forest Dr
- 3030 Oak Forest Dr
- 3046 Oak Forest Dr
- 2002 Bron Holly Dr
- 3050 Oak Forest Dr
- 3026 Oak Forest Dr
- 2003 Stonecrest Dr
- 2003 Bron Holly Dr
- 2006 Bron Holly Dr
- 3054 Oak Forest Dr
- 3022 Oak Forest Dr
- 2007 Stonecrest Dr
- 2007 Bron Holly Dr
- 2010 Bron Holly Dr
- 2002 Wilde Rock Way
- 3058 Oak Forest Dr
- 3018 Oak Forest Dr
- 2011 Stonecrest Dr
- 2002 Stonecrest Dr
- 2011 Bron Holly Dr