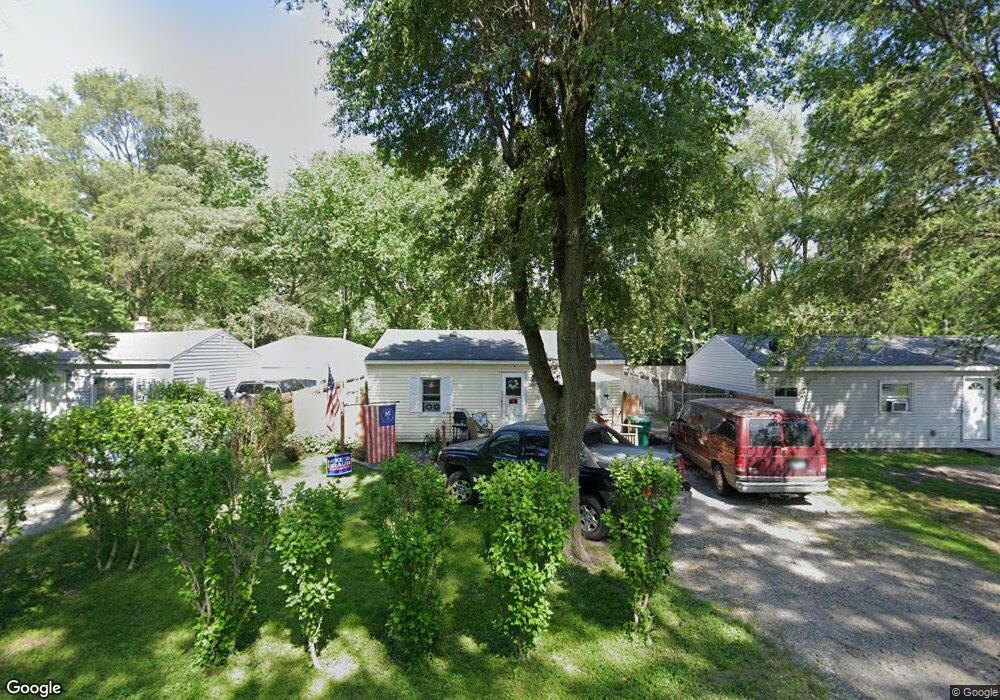
3039 Calhoun St Gary, IN 46406
Black Oak NeighborhoodEstimated Value: $51,000 - $95,000
2
Beds
1
Bath
560
Sq Ft
$122/Sq Ft
Est. Value
About This Home
This home is located at 3039 Calhoun St, Gary, IN 46406 and is currently estimated at $68,495, approximately $122 per square foot. 3039 Calhoun St is a home located in Lake County with nearby schools including Calumet High School, Aspire Charter Academy, and Calumet Christian School.
Ownership History
Date
Name
Owned For
Owner Type
Purchase Details
Closed on
Jun 15, 2018
Sold by
Wilson Lawrence E
Bought by
Buchanan Dina Lynn
Current Estimated Value
Purchase Details
Closed on
Jan 11, 2018
Sold by
Wilson Lauralynn and Wilson Lauralynn
Bought by
Wilson Lawrence E
Purchase Details
Closed on
Mar 10, 2017
Sold by
Wulber Anglea S and Wilson James L
Bought by
Wilson Lawrence E
Purchase Details
Closed on
Feb 15, 2017
Sold by
Wilson Michael W and Wilson James L
Bought by
Wilson Lawrence E
Purchase Details
Closed on
Jan 24, 2017
Sold by
Wilson Brian C and Wilson James L
Bought by
Wilson Lawrence E
Purchase Details
Closed on
Jan 16, 2017
Sold by
Wilson James L and Wilson James L
Bought by
Wilson Lawronce E
Purchase Details
Closed on
Feb 25, 2008
Sold by
Anderson Michael J
Bought by
Wilson James L and Wilson Lawrence E
Create a Home Valuation Report for This Property
The Home Valuation Report is an in-depth analysis detailing your home's value as well as a comparison with similar homes in the area
Home Values in the Area
Average Home Value in this Area
Purchase History
| Date | Buyer | Sale Price | Title Company |
|---|---|---|---|
| Buchanan Dina Lynn | -- | None Available | |
| Wilson Lawrence E | -- | None Available | |
| Wilson Lawrence E | -- | None Available | |
| Wilson Lawrence E | -- | None Available | |
| Wilson Lawrence E | -- | None Available | |
| Wilson Lawronce E | -- | None Available | |
| Wilson James L | $2,364 | None Available |
Source: Public Records
Tax History Compared to Growth
Tax History
| Year | Tax Paid | Tax Assessment Tax Assessment Total Assessment is a certain percentage of the fair market value that is determined by local assessors to be the total taxable value of land and additions on the property. | Land | Improvement |
|---|---|---|---|---|
| 2024 | $2,285 | $28,800 | $5,400 | $23,400 |
| 2023 | $257 | $27,100 | $5,400 | $21,700 |
| 2022 | $257 | $25,700 | $5,400 | $20,300 |
| 2021 | $268 | $26,800 | $5,400 | $21,400 |
| 2020 | $261 | $26,100 | $5,400 | $20,700 |
| 2019 | $359 | $25,400 | $5,300 | $20,100 |
| 2018 | $768 | $23,200 | $4,800 | $18,400 |
| 2017 | $785 | $23,600 | $4,800 | $18,800 |
| 2016 | $641 | $18,700 | $4,800 | $13,900 |
| 2014 | $624 | $21,300 | $5,600 | $15,700 |
| 2013 | $594 | $20,900 | $5,700 | $15,200 |
Source: Public Records
Map
Nearby Homes
- 3135 Burr St
- 2345 Burr St
- 2327 Burr St
- 2320 Burr St
- 2368 Wheeler St
- 2329 Colfax St
- 6800 W 25th Ave
- 2338 Sherman St
- 3945 Gerry St
- 1643 N Indiana Place
- 305 W 35th Ave
- 6016 W 41st Ave
- 1831 Burr St
- 4310 W 22nd Place
- 1234 N Oakwood St
- 2135 Clark Rd
- 1402 N Indiana St
- 3836 W 25th Ave Unit 46
- 1218 N Glenwood Ave
- 709 James Place
- 3043 Calhoun St
- 3035 Calhoun St
- 3047 Calhoun St
- 3031 Calhoun St
- 3040 Tompkins St
- 3044 Tompkins St
- 3048 Tompkins St
- 3036 Calhoun St
- 3104 Tompkins St
- 3021 Calhoun St
- 3030 Calhoun St
- 3075 Tompkins St
- 3071 Tompkins St
- 3081 Tompkins St
- 3061 Tompkins St
- 3015 Calhoun St
- 3024 Calhoun St
- 3035 Tompkins St
- 3028 Tompkins St
- 3033 Tompkins St